Study the following graph and answer the following:–
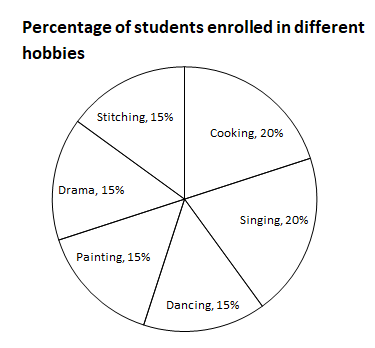
Total number of students = 6000
Q1. The number of students enrolled in cooking are what percent of the number of students enrolled in Painting?
1. 123.33 % 2. 133.33 % 3. 143.33 % 4. 153.33 % 5. None of these
Q2. What is the total number of students enrolled in stitching and singing classes?
1. 2100 2. 2400 3. 2700 4. 3300 5. None of these
Q3. How many students are enrolled in painting classes?
1. 300 2. 450 3. 600 4. 900 5. None of these
Q4. What is the ratio between the number of students enrolled in dancing and stitching together to that of singing and painting together?
1. 5:7 2. 7:5 3. 6:7 4. 7:6 5. None of these
Q5. The number of students enrolled in painting is approximately what percent of that of singing and cooking together?
1. 32.5 % 2. 37.5 % 3. 42.5 % 4. 47.5 % 5. None of these
1. 2
2. 1
3. 4
4. 3
5. 2