study the following pie charts and answer the following questions:
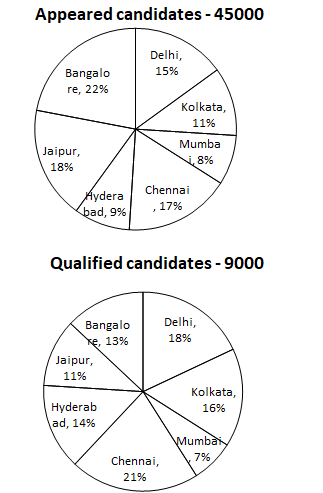
Q1. In which city the percentage qualified candidates with respect to that of appeared candidates is minimum?
1. Delhi 2. Kolkata 3. Mumbai 4. Jaipur 5. none of these
Q2. What is the difference between the number of qualified candidates of Chennai and those of Bangalore?
1. 520 2. 676 3. 720 4. 784 5. none of these
Q3. What is the ratio of appeared candidates from Mumbai and Hyderabad together to that of the appeared candidates from Delhi and Jaipur together?
1. 17:33 2. 11:!3 3. 13:27 4. 17:27 5. none of these
Q4. What is the percentage of qualified candidates with respect to appeared candidates from Kolkata and Mumbai taken together?
1. 23.11 2. 23.21 3. 24.21 4. 21.24 5. none of these
Q5. What is the ratio between the number of candidates qualified from Kolkata and Chennai together to the number of candidates appeared from Mumbai respectively?
1. 37:41 2. 40:37 3. 37:40 4. 38:41 5. none of these
1. 5
2. 3
3. 1
4. 3
5. 3