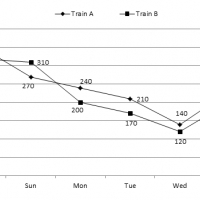
Refer to the following Line Graph and answer the given questions.

Q1. The number of people who travelled by Train B on Friday is 20% more than the people who travelled by the same train on Thursday. What is the respective ratio between the number of people who travelled on Friday and those who travelled on Saturday by the same train?
1. 4:5 2. 3:4 3. 5:6 4. 3:4 5. 1:4
Q2. What is the difference between the total number of people who travelled by Train B on Monday and Tuesday together and the total number of people who travelled by Train A on Saturday and Sunday together?
1. 200 2. 230 3. 210 4. 250 5. 240
Q3. What is the average number of people travelling by Train A on Monday, Tuesday, Wednesday and Thursday?
1. 200 2. 230 3. 205 4. 250 5. 240
Q4. The number of people who travelled by Train A decreased by what percent from Saturday to Tuesday?
1. 30% 2. 40% 3. 30% 4. 42% 5. 33%
Q5. The total number of people who travelled by both the given trains together on Sunday is approximately what percent more than the total number of people who travelled by both the given trains together on Wednesday?
1. 128% 2. 123% 3. 142% 4. 118% 5. 135%
1.2
2.4
3.3
4.2
5.1