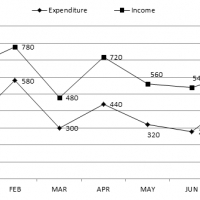
Refer to the following Line Graph and answer the given questions.
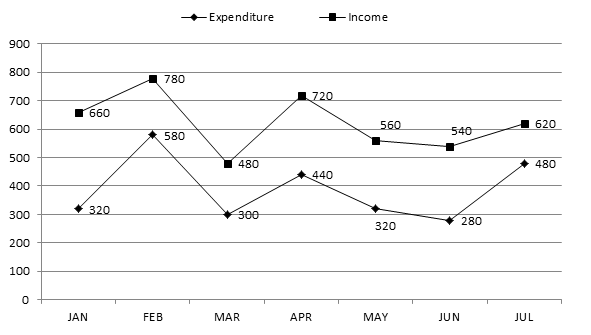
Q1. By What approximate percent is the profit earned by the company in the month of February less than that earned in the month of January?
1. 32% 2. 35% 3. 41% 4. 45% 5. None of the Above
Q2. What is the difference between the total profit(in Rs. Thousand) earned by the company in the months of February, April and July and that earned in the months of January, March and June?
1. 120 2. 130 3. 140 4. 160 5. None of the Above
Q3. What is the respective ratio between the percentage profits earned by the company in the months of March and May?
1. 4:5 2. 2:3 3. 5:4 4. 8:3 5. None of the Above
Q4. What is the approximate average expenditure of the company in the given months?(In Rs.Thousand)
1. 385 2. 389 3. 365 4. 375 5. 370
Q5. In how many months, the income of a company was more than the average income during the given months?
1. 1 2. 2 3. 3 4. 4 5. None of the Above
1. 3
2. 4
3.1
4.1
5.3