Refer to the Line Graph and answer the given questions.
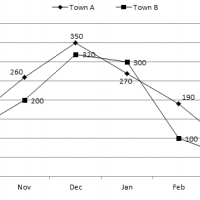
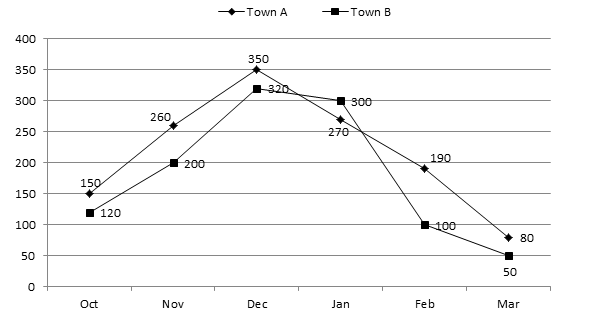
Number of gloves of ‘XYZ’ brand sold in Town A and Town B in 6 different months.
Q1. The number of gloves sold in Town B increased by what percent from October to December?
1. 500/3 % 2. 400/3 % 3. 100/3 % 4. 200/3 % 5. None of the Above
Q2. What is the difference between the total number of gloves sold in both the towns together in January and the total number of gloves sold in both the towns together in February?
1. 280 2. 270 3. 290 4. 260 5. 250
Q3. The number of gloves sold in town A in November is what % more than the number of gloves sold in Town B in the same months?
1. 32% 2. 28% 3. 25% 4. 30% 5. 20%
Q4. What is the average number of gloves in Town A in October, November, December and March?
1. 215 2. 220 3. 225 4. 210 5. 205
Q5. The total number of gloves sold in Town B in September is 20% less than the number of gloves sold in same town in October. what is the respective ratio between the number of gloves sold in September and those sold in December in the same town?
1. 2:9 2. 1:5 3: 4:9 4. 2:7 5. 3:10
1.1
2.1
3.4
4.4
5.5