Directions for questions 46 to 50: Study the following graph and answer the questions given below:
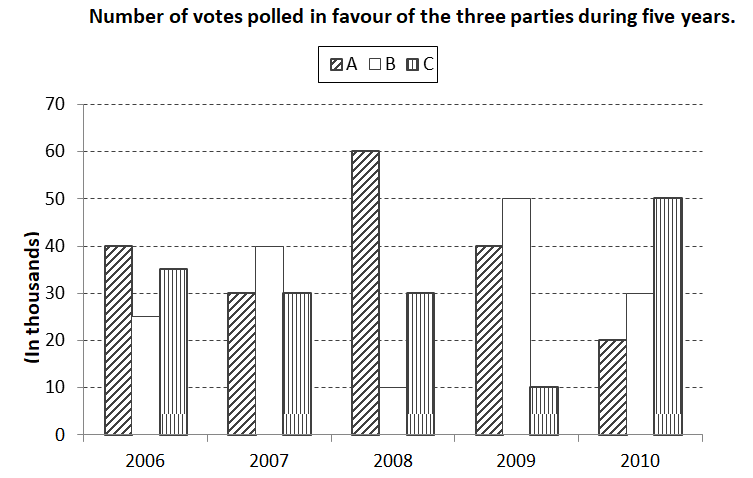
Q1.Choose the party that won the elections maximum number of times.
1 : A and B 2 : A and C 3 : B and C 4 : A 5 : B
Q2. In which year there was a maximum % increase in votes polled for party B When compared to the previous years?
1 : 2009 2 : 2010 3 : 2007 4 : Cannot be determined 5 : None of these
Q3. Parties A and C, being allies, got merged in 2011 elections. If the expectations in 2011 were same as 2009 polls, what could be the chance of A and C winning?
1 : 60% 2 : 30% 3 : 50% 4 : 40% 5 : None of these
Q4. The total number of votes polled in favour of A in 2008 and 2010 is what percentage of the total number of votes polled in favour of all the three parties in the same years?
1 : 22% 2 : 31% 3 : 40% 4 : 43% 5 : None of these
Q5. What is the ratio of the total number of votes polled for A and B in 2006 to those polled for C in 2008?
1 : 13 : 6 2 : 2 : 1 3 : 15 : 8 4 : 16 : 9 5 : None of these
1. 1
2. 1
3. 3
4. 3
5. 1