Directions for questions: Study the following bar graph carefully and answer the questions that follow.
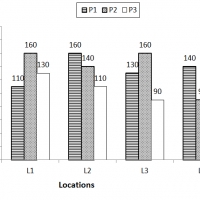
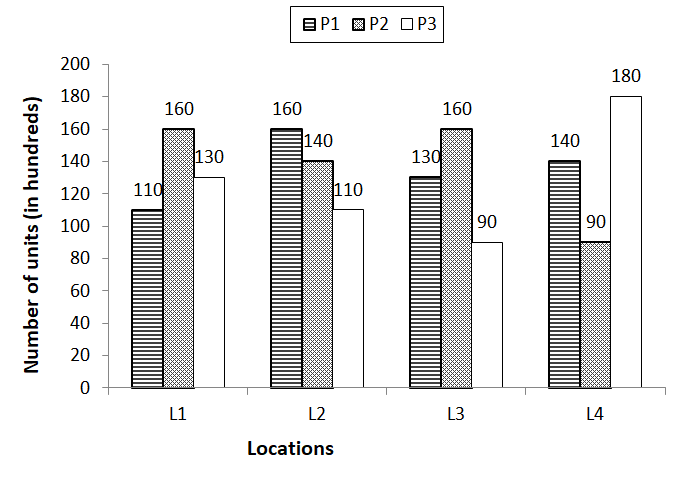
Number of units of three different products P1, P2 and P3, produced (units in hundreds) at four different locations (L1, L=, L3 and L4) of a factory the graph.
Q1. What is the total number of units of P2 produced (in hundreds) in the four locations together?
1 : 540 2 : 550 3 : 510 4 : 530 5 : None of these
Q2. What is the average number of units (in hundreds) of P1 produced per location?
1 : 135 2 : 155 3 : 165 4 : 175 5 : None of these
Q3. In which location is the maximum number of units produced?
1 : L2 2 : L1 3 : L4 and L2 4 : L3 and L1 5 : None of these
Q4. By what approximate percent is the number of units of P1 produced more than the number of units of P3 produced in the four locations together?
1 : 10.9% 2 : 12.4% 3 : 16.5% 4 : 18.7% 5 : 5.9%
Q5. If the production cost of each of product P2 is Rs.430, then what is the total production cost of P2?
1 : Rs.2,26,200 2 : Rs.2,36,500 3 : Rs.2,46,800 4 : Rs.2,56,400 5 : None of these
1. 2
2. 1
3. 3
4. 5
5. 5