Direction(1-5): Study the following graph carefully to answer the questions given below
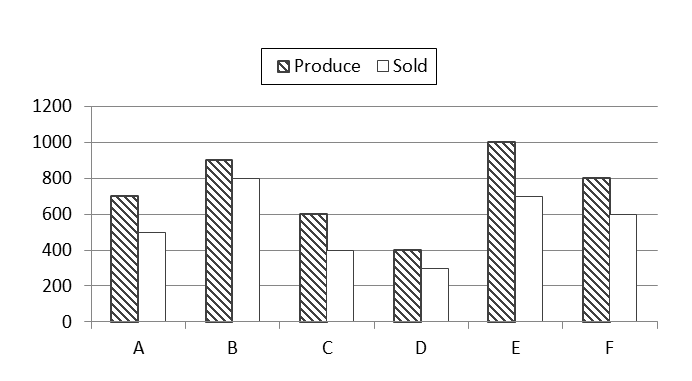
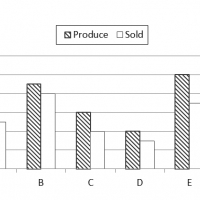
P : 700 900 600 400 1000 800
S: 500 800 400 300 700 600
A B C D E F
Q1.What is the average number of units produce by all companies together ?(approx)
1. 700 2. 720 3. 733 4. 740 5. 750
Q2. Which company had the lowest percentage of sales with respect to its production?
1. CompanyA 2. CompanyB 3. CompanyC 4. CompanyD 5. CompanyE
Q3. What is the ratio of the total production of the company B and C together to the total sales of the same companies?
1. 4:5 2. 5:4 3. 5:2 4. 2:3 5. None of these
Q4. The total unit sold by D ,E ,F together is approximate what percentage of the total units produced by these companies?
1. 72% 2. 72.12% 3. 72.22% 4. 72.72% 5. 73.67%
Q5. What is the ratio of total production of all the companies to the total sales of all the companies?
1. 4:3 2. 3:4 3. 3:2 4. 2:3 5. None of these
1. 3
2. 3
3. 2
4. 4
5. 1