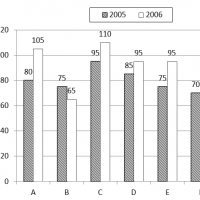
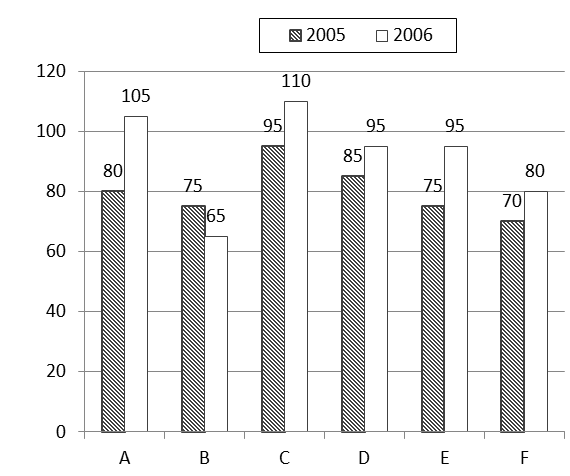
Sales of mobile phone in the year 2005 and 2006 by the six branches A, B, C, D, E and F. Study the graph and answer the following questions.
Q1.Find the ratio of total sales of B in both years to the total sales of branch D in both years.
1. 9:7 2. 7:9 3. 5:3 4. 3:5
Q2. What is the average number of mobile phones sold in 2005 ?
1. 60 2. 65 3. 70 4. 80
Q3. Which branch sold the maximum number of mobile phones in both years ?
1. A 2. B 3. C 4. D
Q4. What is the difference between the number of mobile phones sold in 2005 by branch A and 2006 by branch D ?
1. 5 2. 10 3. 15 4. 20
Q5. Number of mobile phones sold by branch C is what percentage of the Total Number of mobile phones sold in 2006 ?
1. 10% 2. 20% 3. 25% 4. 30%
1. 2
2. 4
3. 3
4. 3
5. 2