Directions (Q.6 – 10): Study the following pie chart shows the percentage of the total number of aspirants applied for various Govt. examinations in 2016.
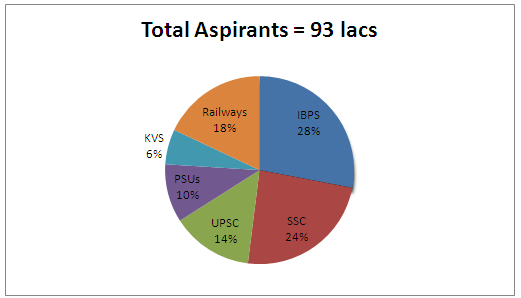
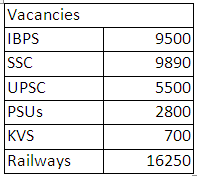
Q6. Average number of aspirants applied for a Govt. exam is approximately how many times the total no. of vacancies?
(a) 39
(b) 32
(c) 35
(d) 38
(e) 41
Q7. If Railways reduces two-fifth of its vacancies, then total vacancies will be reduced by how much percent?
(a) 13.56%
(b) 14.56%
(c) 18.2%
(d) 17%
(e) None of these
Q8. What will be the approximate difference between no of aspirant per post in SSC to the no of aspirant per post in IBPS?
(a) 50
(b) 41
(c) 45
(d) 52
(e) 48
Q9. For each vacancy, 4 will be selected for interview after written exam and one will be finally selected. If no. of vacancies of IBPS increased by 10%. No of aspirant qualified for Interview for IBPS is approximately how many times the no of aspirant qualified for interview in PSUs and KVS together.
(a) 3
(b) 3.5
(c) 5
(d) 4.5
(e) 2
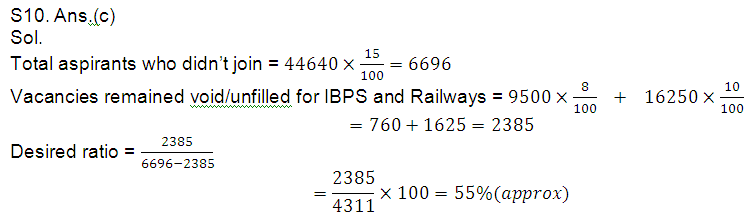
Q10. Out of all vacancies allocated, 15% of the selected aspirants didn’t join. Hence 8% of the IBPS and 10% of Railways vacancies remain unfulfilled. What is approximate percent of total vacancies remain unfulfilled for IBPS and Railways to the rest of the organisations vacancy which remain unfulfilled.?
(a) 33
(b) 44
(c) 55
(d) 50
(e) 60
Answer & Explanation