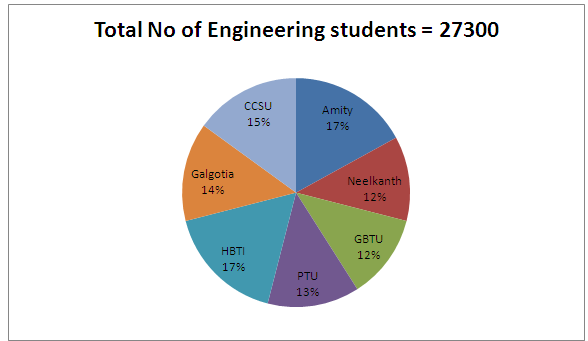
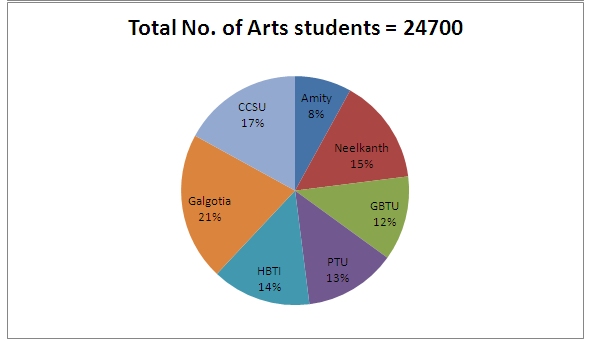
Directions (Q.1–5): The following pie chart shows the distribution of Students of Engineering and Arts students enrolled in seven different universities. Read the following questions and answer it carefully.
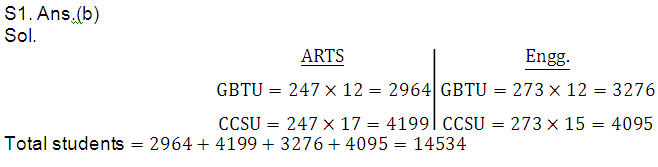
Q1. What is the total number of students of Engineering and Arts from Both GBTU and CCSU.?
(a) 13824
(b) 14534
(c) 12167
(d) 17576
(e) None of the above
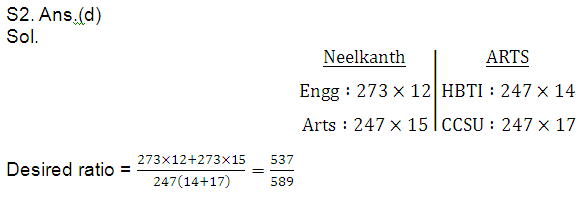
Q2. What will be the ratio of no. of students from Neelkanth of both stream to the no. of students of Arts from HBTI and CCSU?
(a) 82 : 85
(b) 729 : 1089
(c) 829 : 1043
(d) 537:589
(e) None of these
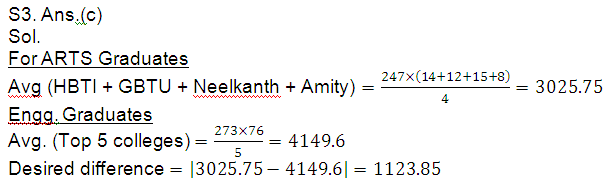
Q3. What will be the difference between the average no of students of Arts from HBTI ,GBTU , Neelkanth & Amity Universities and average no of students of Engineering students from top 5 universities according to no of students enrolled?
(a) 1050
(b) 1193.85
(c) 1123.85
(d) 1089
(e) 1117
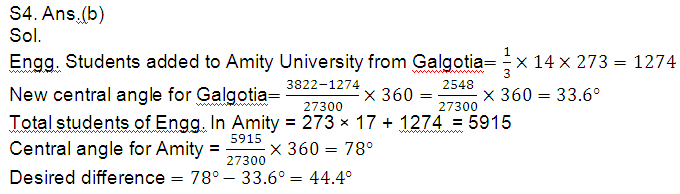
Q4. If one-third of engineering students to be enrolled in Galgotia changed their mind and joined Amity University instead. What will be the difference between new central angle of Both Galgotia and Amity University now?
(a) 54.4°
(b) 44.4°
(c) 47.6°
(d) 45.9°
(e) None of the above
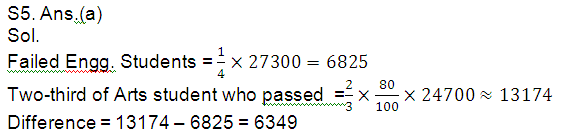
Q5. 75% of engineering students passed in first year while 80% of arts students entered into second year. What is the difference between the no. of failed engineering students andtwo-third of passed Arts students?
(a) 6349
(b) 6400
(c) 6449
(d) 6198
(e) 6000
Answer & Explanation