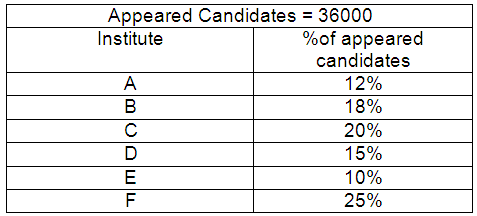
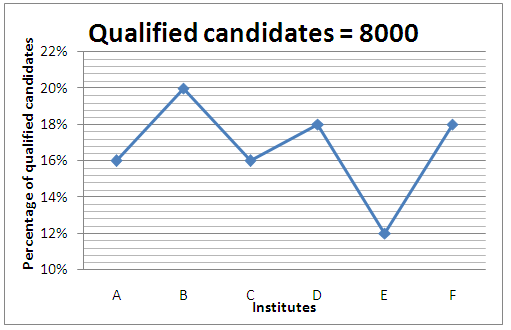
Directions (Q.11-15): Study the following table and bar graph to answer the questions given below it.
Percentage of appeared and qualified candidates in a competitive examination from different institutes
Q11. What is the ratio of the qualified candidates from institutes A, B and C together to the appeared candidates from institutes D, E and F?
(a) 52 : 225
(b) 26 : 125
(c) 125 : 26
(d) 13 : 200
(e) None of these
Q12. What per cent of the candidates from institute ‘E’ has been declared qualified out of the total candidates appeared from this institute?
(a) 16%
(b) 26%
(c) 16.66%
(d) 18%
(e) None of these
Q13. What is the approximate percentage of students qualified w.r.t. to those appeared from the institutes B and C together?
(a) 20
(b) 21
(c) 22
(d) 23
(e) 24
Q14. Which institute has the highest percentage of candidates qualified w.r.t. to those appeared?
(a) A
(b) B
(c) C
(d) D
(e) None of these
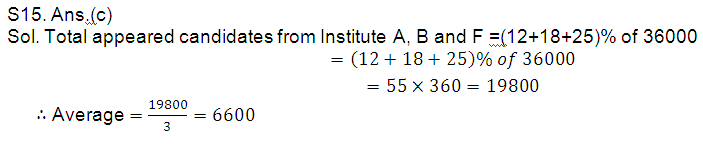
Q15. What is the average number of appeared candidates from the institutes A, B and F together?
(a) 19800
(b) 2200
(c) 6600
(d) 8600
(e) None of these
Answer & Explanation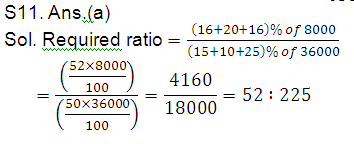
![]()