Directions (Q.6-10): Seven companies A, B, C, D, E, F and G are engaged in the production of two items I and II. Comparative data about the production of these items by the companies is given in the following graph and table. Study them carefully and answer the questions given below.
Percentage of the total production produced by the seven companies

Cost of the total production (both items together) by seven companies = Rs 25 crores
Ratio of production between items I and II and the percent profit earned for the two items

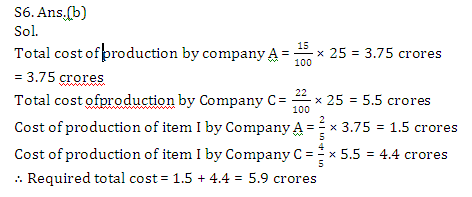
Q6. What is the total cost of the production of item I by companies A and C together in Rs crore?
(a) 9.25
(b) 5.9
(c) 4.1625
(d) 4.9
(e) None of these
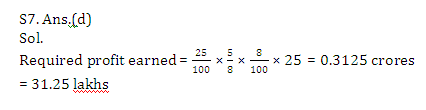
Q7. What is the amount of profit earned by company D on item II?
(a) Rs 3.125cr
(b) Rs 31.25 cr
(c) Rs 3.125 lakhs
(d) Rs 31.25 lakhs
(e) None of these
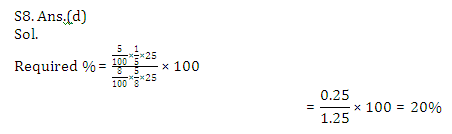
Q8.Cost of production of item I by company F is what per cent of the cost of production of item II by company D?
(a) 16%
(b) 33.33%
(c) 66.67%
(d) 20%
(e) None of these
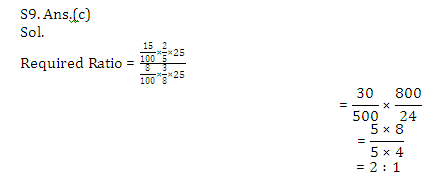
Q9.What is the ratio of the cost of production of item I by company A to the cost of production of item I by company D?
(a) 3 : 5
(b) 1 : 2
(c) 2 : 1
(d) 2 : 3
(e) None of these
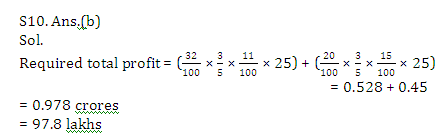
Q10. What is the total of the profit earned by company B on the production of item I and the profit earned by company A on production of item II?
(a) Rs 9.78 cr
(b) Rs 97.8 lakhs
(c) Rs 52.8 lakhs
(d) Rs 5.28 cr
(e) None of these
Answer & Explanation