Directions (Q.1-5): The following graph shows the percentage of discount offered on the total discount given in any month for 5 various products P, Q, R, S and T in a given month by a shopkeeper
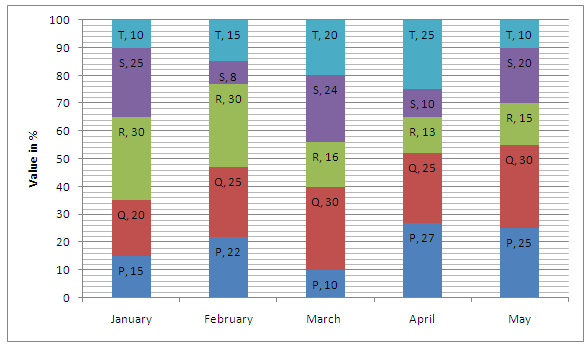
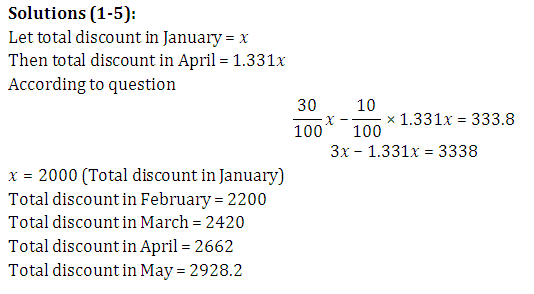
Condition 1: Total value of discount offered on all products increases by 10% every month.
Condition 2: Difference between the discount of R in January and discount of S in April is Rs. 333.8.
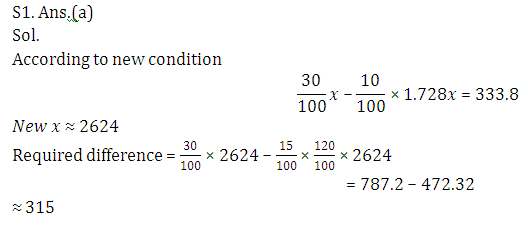
Q1. If total discount per month would have been increased by 20% instead of 10% as given above and condition 2 remains the same for new rate then, difference in value of discount of R in January and T in February according to new rate (approximately)
(a) 315
(b) 330
(c) 305
(d) 405
(e) 415
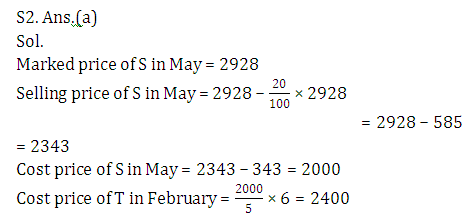
Q2. What is the cost price of article T in February if ratio of cost price of T in February and cost price of S in May are in the ratio 6 : 5 and profit of S in May is Rs 343. (Approximately)
(a) 2400
(b) 2500
(c) 2000
(d) 1800
(e) 1500
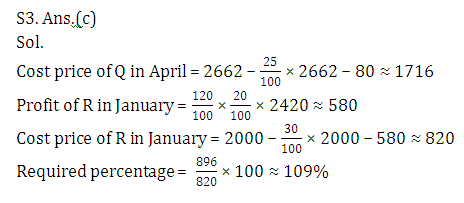
Q3. Cost price of Q in April is what percent more or less than the cost price of R in January if profit of Q in April is 280 and profit of R in January is 20% more than the discount of T in March. (approximately)
(a) 98%
(b) 92%
(c) 109%
(d) 113%
(e) 102%
Q4. If there are 82 articles of R are sold in March and Profit percent per article of R in March is 25/4% more of the percent value of discount of R in March then find the total profit in selling all articles. (approximately)
(a) 22500
(b) 17500
(c) 19250
(d) 24200
(e) 26300
Q5. If shopkeeper had 10 units of Q type products in February in which 2 articles are spoiled then he should sell the remaining articles at what price so that there is overall gain of 20% if there is a profit of 125/7% on selling a unit of Q type product initially. (approximately)
(a) 2100
(b) 1800
(c) 1500
(d) 1400
(e) None of these
Answer & Explanation