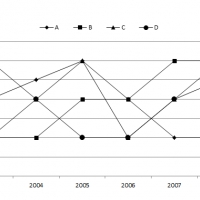
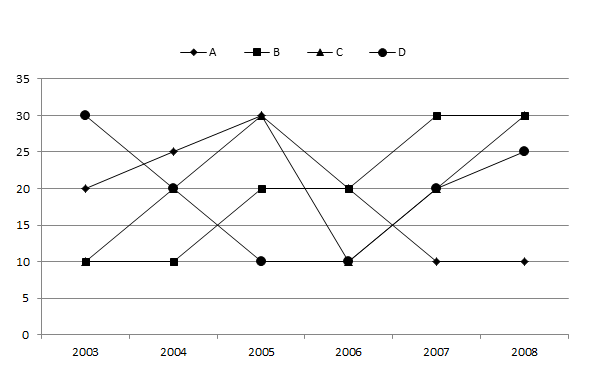
Following Line graph shows the percentage increase in the salaries of four persons during the years 2003 to 2008 with respect to previous year.
Q1. Which of the following is the average percentage increase in the salary of C during the six years?
1. 20% 2. 40% 3. 15% 4. 10%
Q2. If the ratio of salaries A and B at the end of the year 2002 was 4:3, then what was the ratio of their salaries at the end of year 2008?
1. 20:44 2. 40:39 3. 50:39 4. 50:44
Q3. If the salaries of B and D were equal at the end of the year 2004, then what was the ratio of the salaries of B and D at the end of the year 2005?
1. 12:13 2. 14:19 3. 12:11 4. 15:14
Q4. If the ratio of salaries of A, B, C and D at the end of the year 2004 was 7:11:17:13, then what was the ratio of their salaries at the end of the year 2007?
1. 2:13:17:19 2. 4:19:13:17 3. 7:12:17:11 4. 15:14:17:11
Q5. If the salary of D at the end of the year 2002 was Rs. 50000, then what was his salary at the end of 2007?
1. Rs. 2,13,719 2. Rs. 1,13,016 3. Rs. 1,13,256 4. Rs. 1,15,417
1. 1
2. 3
3. 3
4. 3
5. 3