
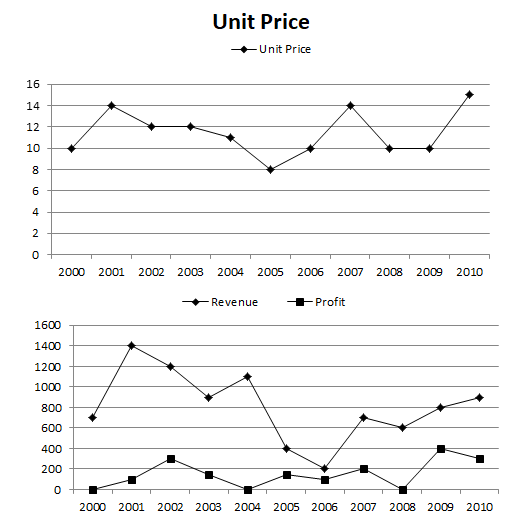
Answer the following questions, based on the following two graphs, assuming that there is no fixed component and all the units produced are sold in the same year.
Q1. In which year per unit cost is lowest?
1. 2002 2. 2003 3. 2006 4. 2007
Q2. In which year per unit cost is highest?
1. 2001 2. 2005 3. 2006 4. 2007
Q3. What is the approximate average quantity sold during the period 2000-2010?
1. 50% 2. 60% 3. 81% 4. 70%
Q4. What is the average number of total units sold in the years of 2002,2003,2004,2005 and 2008 together?
1. 88 2. 66 3. 77 4. 44
Q5. If the price per unit decrease by 10% during 2000-2004 and cost per unit increase by 10% during 2005-2010, then the cumulative profit for the entire period 2000-2010 decrease by?
1. 700 2. 500 3. 565 4. 775
1. 3
2. 1
3. 4
4.3
5.4