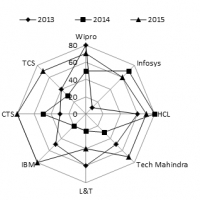
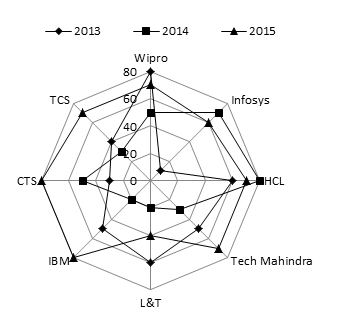
Study the Radar Graph carefully and answer the questions given below.
The graph shows annual income (in Crore) of eight companies (CTS, TCS, Wipro, Infosys, HCL, Tech Mahindra, IBM, L&T) in three years 2013, 2014, 2015.
Q1. Which of the following company earns the maximum income during three years?
1. TCS 2. Infosys 3. HCL 4. Tech Mahindra
Q2. Income of CTS in 2014 is what percentage less than the income of Infosys in 2015?
1. 50/3% 2. 55/3% 3. 59/3% 4. 61/3%
Q3. If the profit of IBM is 12% of its annual income in 2013 and the profit of Wipro is 14% of its annual income in 2015, then what is the difference between the expenditure of Wipro in 2015 and that of IBM in 2013?
1. 16.2 crore 2. 17.2 crore 3. 18.2 crore 4. 19.2 crore
Q4. If the expenditure of Tech Mahindra is 82% of its income in 2014 and that of Wipro is 84% of its income in 2015. What is the ratio of their profits in 2014 to that in 2015.
1. 27:56 2. 33:57 3. 25:56 4. 25:57
Q5. What is the ratio of the total income of HCL and Tech Mahindra over the given period?
1. 7:5 2. 3:5 3. 2:5 4. 2:7
Answers
1.3
2.1
3.1
4.1
5.1