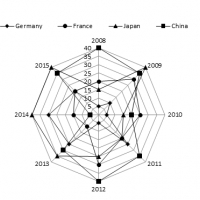
Study the following Radar Graph and answer the given questions
Number of new countries registered (in thousand) in four countries in various years.

Q1. In which year is the average of the number of companies registered the maximum?
1. 2008 2. 2010 3. 2009 4. 2011
Q2. The number of companies registered in 2015 is what percentage more or less than the number of companies registered in the year 2008?
1. 44.44% 2. 43.75% 3. 22.22% 4. 11.11%
Q3. What is the ratio of the number of companies registered in Japan to that in China during 2008 to 2015?
1. 39:40 2. 23:24 3. 40:41 4. 24:23
Q4. The total number of companies registered in France is how much more or less than the total number of companies registered in China?
1. 34.14% 2. 33.13% 3. 29.16% 4. 11.11%
Q5. In which country is the average number of companies registered the maximum?
1. Germany 2. Japan 3. China 4. France
Answers
1.3
2.2
3.2
4.3
5.3