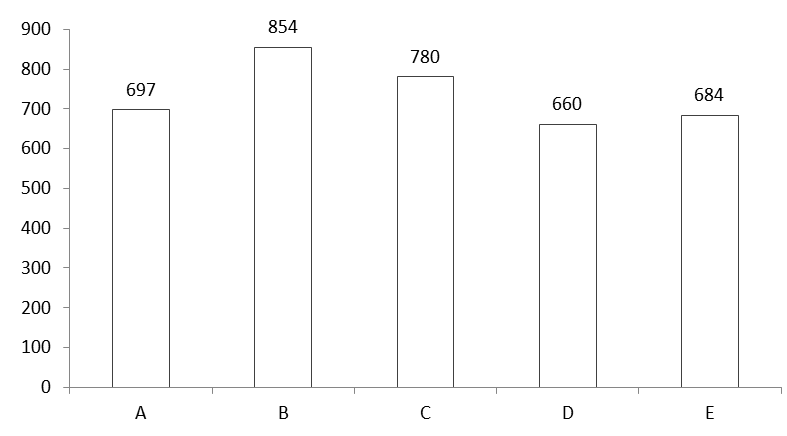
Study the following graph and table carefully to answer the given questions.
Number of employees working in 5 different Companies

Ratio of Male and Female ratio
| Company | Male | Female |
| A | 12 | 5 |
| B | 4 | 3 |
| C | 7 | 8 |
| D | 9 | 11 |
| E | 20 | 18 |
Q1.What is the total number of male employee in all the companies together ?
1. 2010 2. 2001 3. 2100 4. 2140 5. None of these
Q2.What is the average number of female employee taking all the years together ?
1. 432 2. 278 3. 384 4. 335 5. None of these
Q3. What is the ratio of male and female employee working in companies D and E together ?
1. 217:221 2. 43:47 3. 124:127 4. 219:229 5. None of these
Q4. By what % is the no of total employees of company C more than that of Company D ?
1. 18.18% 2. 16.75% 3. 22.65% 4. 7.25% 5. None of these
Q5. By what % is the no of employees working in companies A and C more than that of female employees working in companies B and D ?
1. 112.5% 2. 96.2% 3. 102.6% 4. 124.5% 5. None of these
1. 2
2. 4
3. 4
4. 1
5. 3
