
Study the following Graph carefully to answer the given questions
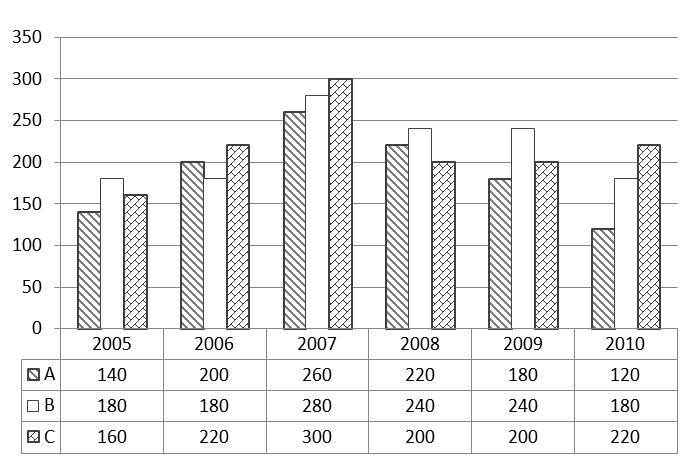
Q1. What is the % increase in the income of Company B from 2006 to 2008?
1. 12.5% 2. 33.33..% 3. 40% 4. 37.2% 5. None of these
Q2. The total income of all three companies together was minimum in which of the following years?
1. 2010 2. 2007 3. 2005 4. 2008 5. None of these
Q3. In which year was the % increase in the income of Company C from the previous year maximum?
1. 2007 2. 2010 3. 2005 4. 2006 5. None of these
Q4. What is the ratio of total income of all three companies in 2005 to that in 2006?
1. 4:5 2. 5:3 3. 3:5 4. 4:7 5. None of these
Q5. The income of Company C in 2008 is what % of the income of Company B in 2009?
1. 83.33% 2. 89% 3. 78% 4. 90% 5. None of these
1. 2
2. 3
3. 4
4. 1
5. 1