Directions (Q1-5: Study the following pie-chart and table carefully and answer the questions given below:
Percentage-wise distribution of the number of mobile phones sold by a shopkeeper during six months

The ratio between the numbers of mobile phones sold of Company A and Company B during six months

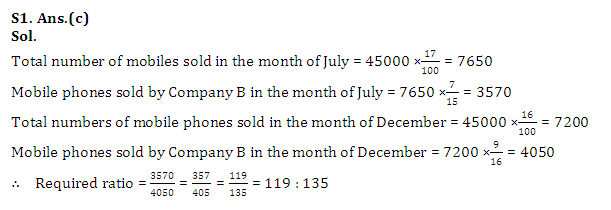
Q1. What is the ratio of the number of mobile phones sold of Company B during July to those sold during December of the same company?
(a) 119: 145
(b) 116: 135
(c) 119: 135
(d) 119: 130
(e) None of these
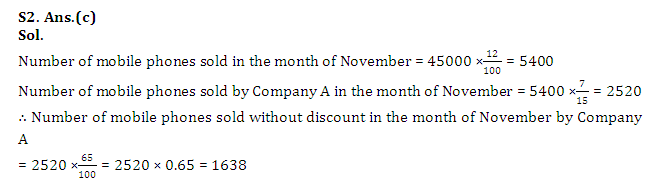
Q2. If 35% of the mobile phones sold by Company A during November were sold at a discount, how many mobile phones of Company A during that month were sold without a discount?
(a) 882
(b) 1635
(c) 1638
(d) 885
(e) None of these
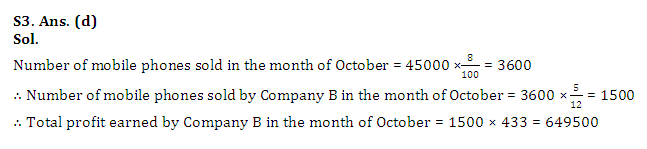
Q3. If the shopkeeper earned a profit of Rs. 433 on each mobile phone sold of Company B during October, what was his total profit earned on the mobile phones of that company during the same month?
(a) Rs. 6,49,900
(b) Rs. 6,45,900
(c) Rs. 6,49,400
(d)Rs. 6,49,500
(e) None of these
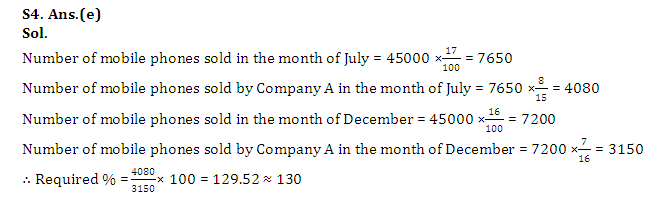
Q4. The number of mobile phones sold of Company A during July is approximately what percent of the number of mobile phones sold of Company A during December?
(a) 110
(b) 140
(c) 150
(d) 105
(e) 130
Q5. What is the total number of mobile phones sold of Company B during August and September together?
(a) 10000
(b) 15000
(c) 10500
(d) 9500
(e) None of these
Answer & Explanation