Directions (Q11-15): Study the following line graph and answer the questions based on it.
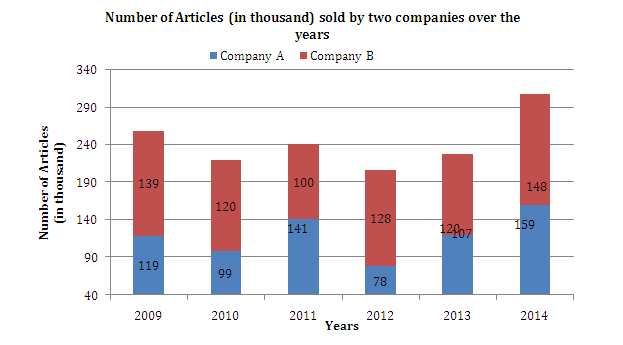
Q11. What is the ratio of number of articles sold by company A in year 2010, 2012 and 2014 together to the number of articles sold by company B is 2011, 2013 and 2014?
(a) 336/375
(b) 436/453
(c) 353/553
(d) 342/451
(e) None of these
Q12. If 24% of articles sold by company A in 2013 and 22% of articles sold by company A in 2014 are defective. Then defective articles sold by A in 2013 and 2014 are what percent less than articles sold by company B in 2010 and 2012 together? (Approx)
(a) 70%
(b) 74%
(c) 80%
(d) 72%
(e) None of these
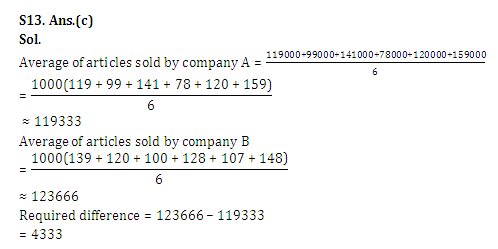
Q13. What is the approximate difference between the average of articles sold by company A and B in over the given period?
(a) 4320
(b) 3320
(c) 4333
(d) 3333
(e) None of these
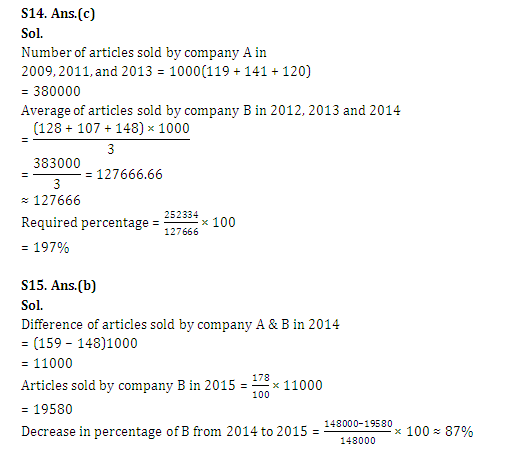
Q14. Number of articles sold by company A in 2009, 2011 and 2013 together is approximately what percent more than the average of article’s sold by company B in year 2012, 2013 and 2014?
(a) 190%
(b) 200%
(c) 197%
(d) 180%
(e) None of these
Q15. If number of articles sold by company B in 2015 is 78% more than the difference between articles sold by company A and Company B in 2014 then find the approximately increase are decrease in the articles sold by company B in 2015 from previous year
(a) 77% increase
(b) 87% decrease
(c) 77% decrease
(d) 92% decrease
(e) None of these
Answer & Explanation