Study the following graph carefully to answer the given questions
Number of Products purchased by 3 companies X,Y and Z
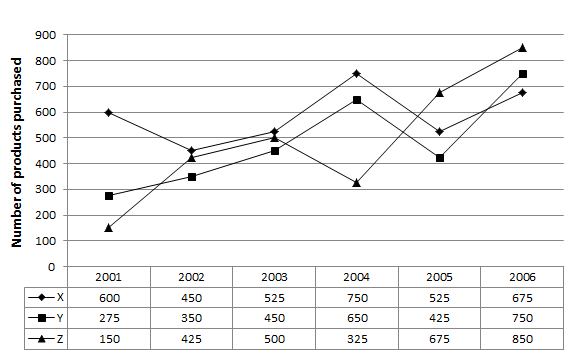
Q1. The number of products purchased by Company Y increased in 2003 by what % of the number of products purchased by Company X in 2001 ?
1. 75% 2. 70% 3. 50% 4. 85% 5. None of these
Q2. The number of products purchased by company Z is increased by what % from 2002 to 2006 ?
1. 25% 2. 75% 3. 50% 4. 100% 5. None of these
Q3.Out of the total no of products purchased by Company X and Z together in 2002, only 12% of the products returned. What is the total no of products returned Company X and Z together in 2002 ?
1. 100 2. 105 3. 120 4. 145 5. None of these
Q4. What is the average number of products purchased by Company Y during 2001, 2003, 2005 and 2006 ?
1. 475 2. 535 3. 520 4. 310 5. None of these
Q5. What is the ratio of the number of products purchased by company Y and Z together in 2002 to the number of products purchased by company X and Z together in 2005 ?
1. 43:50 2. 24:55 3. 48:31 4. 31:48 5. None of these
1. 1
2. 4
3. 2
4. 1
5. 4