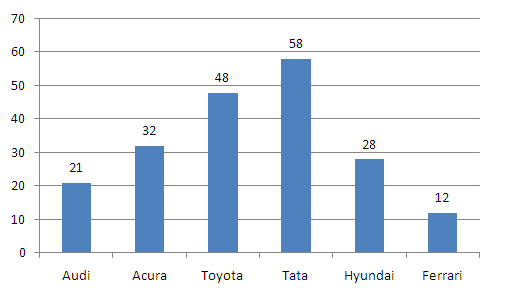
Directions (Q.6-10): The bar graph shows the sales of six different car-manufacturers in 2015 (in thousands of units) in India. The pie-chart shows the break-up of sales of Brand TATA in 2013 in different states of India.
Note→ All manufactured cars are sold in these given 7 states.
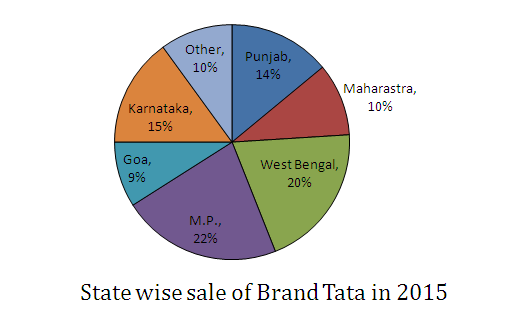
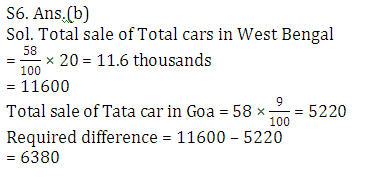
Q6. What is the difference between the sales of Tata in West Bengal and that in Goa?
(a) 50600
(b) 6380
(c) 6567
(d) 6220
(e) None of these
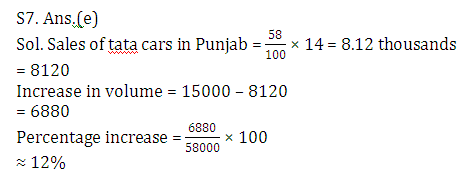
Q7. By what percent should the sales of brand Tata is increased so that it sales volume in Punjab becomes 15000, while the volume of sales in all other state remains the some (approximately)
(a) 10%
(b) 9%
(c) 7%
(d) 13%
(e) 12%
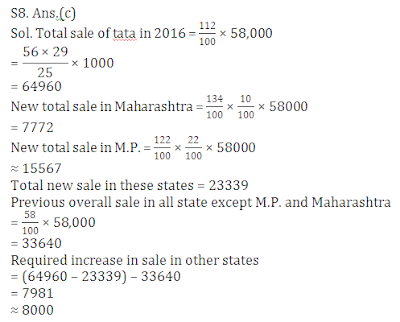
Q8. If in 2016, the total sale of Brand Tata increase by 12%, while its sale in Maharashtra is increased by 34% and in M.P. by 22%, what is the approximate sales increase in the rest of the states.
(a) 7000
(b) 6500
(c) 8000
(d) 10,000
(e) 12500
Q9. Total sale of Audi, Acura and Toyota in 2015 is what percent of the total sales of tata in all states together in that year, 2015. (approximately)
(a) 100%
(b) 113%
(c) 190%
(d) 175%
(e) 150%
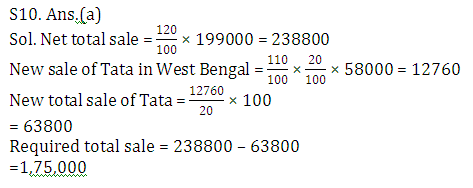
Q10. If total sale of all brands together increases by 20% in 2016 and sale of Tata in West Bengal increase by 10% keeping % percentage distribution of Tata in these seven states same as previously then, what is the total sale of all cars in 2016 of all brands except brand Tata.
(a) 1,75,000
(b) 1,50,000
(c) 2,00,000
(d) 1,00,000
(e) None of these
Answer & Explanation