
Study the following bar graph and table carefully and answer the following questions given below.
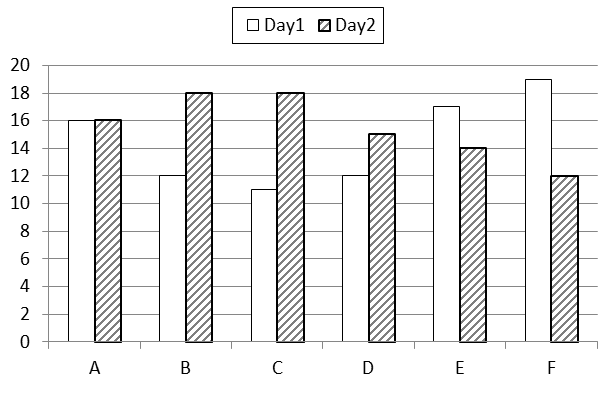
Time taken to travel (in hours) by six vehicles on two different days
Distance covered by six vehicles on each day
| Vehicle | Day 1 | Day 2 |
| A | 832 | 864 |
| B | 516 | 774 |
| C | 693 | 810 |
| D | 552 | 765 |
| E | 935 | 546 |
| F | 703 | 636 |
Q.1 Which of the following vehicles travelled at the same speed on both the days?
1. Vehicle A
2. Vehicle B
3. Vehicle C
4. Vehicle D
Q2. What was the difference between the speed of vehicle A on day 1 and the speed of the vehicle on the same day?
1. 22 kmph
2. 11 kmph
3. 10 kmph
4. 13 kmph
Q3. What was the speed (in m/s) of vehicle C on day 2?
1. 12.5 m/s
2. 11.5 m/s
3. 10.5 m/s
4. 9.5 m/s
Q4. The distance travelled by vehicle F on day 2 was approximately what % of the distance travelled by it on day 1?
1. 90%
2. 95%
3. 94%
4. 98%
Q5. What is the ratio of speeds of vehicle D and Vehicle E on day 2?
1. 14:15
2. 17:13
3. 15:16
4. 13:17
1. 2
2. 2
3. 1
4. 1
5. 2