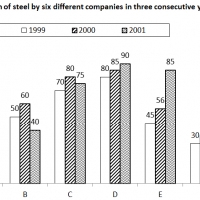
Directions for questions : These questions are based on the bar graph given below.
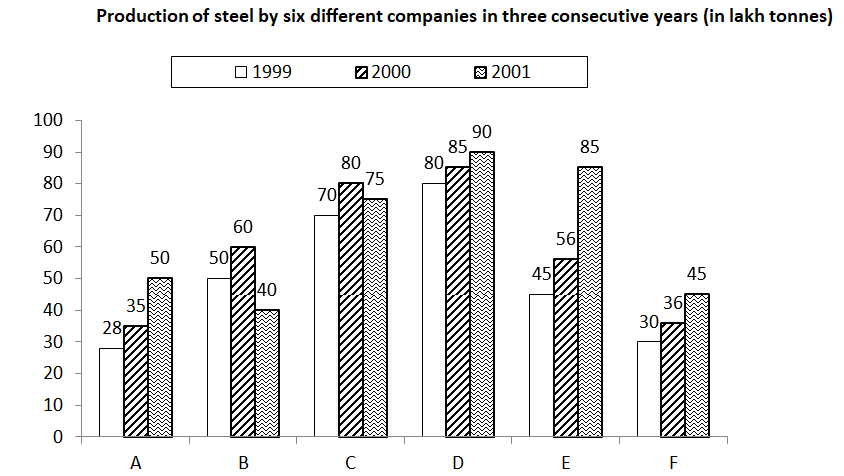
Q1. For which of the following companies is the percentage increase in the production of steel the highest from 1999 to 2000?
1 : A 2 : B 3 : D 4 : E 5 : F
Q2. For which of the following companies is the average production for all the three years the least?
1 : A 2 : B 3 : C 4 : E 5 : F
Q3. Approximately by what percentage was the total production of all the six companies in 2000 more than the total production of all the companies in 1999?
1 : 11% 2 : 12% 3 : 13% 4 : 14% 5 : 16%
Q4. The total production of company A for the given years exceeds that of the company F by approximately _______.
1 : 1.8% 2 : 2% 3 : 2.2% 4 : 2.4% 5 : 3%
Q5. The average annual growth in the production of steel of company D is _______ (lakh tonnes).
1 : 2.5 2 : 3.3 3 : 5 4 : 6.6 5 : None of these
1. 1
2. 5
3. 5
4. 1
5. 3