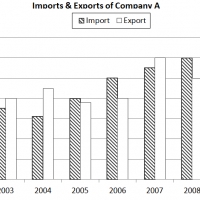
Study the following graph to answer the given questions
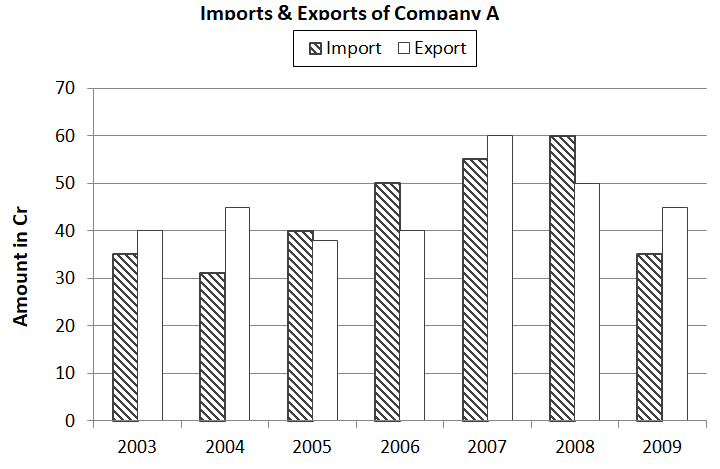
2003 2004 2005 2006 2007 2008 2009
35 31 40 50 55 60 35 I
40 45 38 40 60 50 45 E
Q1. What is the ratio of total imports to the total exports for all the given years ?
1. 53:51 2. 51:53 3. 46:68 4. 15:17 5. None of these
Q2. During which year the % of imports rise compared to the previous year is maximum?
1. 2007 – 08 2. 2006 – 07 3. 2003 – 04 4. 2004 – 05 5. None of these
Q3. What is the percentage increase in the export from 2004 – 07 ?
1. 33.33% 2. 35% 3. 23.65 4. 45% 5. None of these
Q4. Find the average imports for the years 2003, 2006 and 2009 ?
1. 25 2. 65 3. 40 4. 45 5. None of these
Q5. The total exports in the year 2005,2006 and 2009 together are what % of the total imports during the same period ?
1. 98.4% 2. 94.8% 3 . 96.5% 4. 86.6% 5. None of these
1. 2
2. 4
3. 1
4. 3
5. 1