Study the following graph to answer the following questions
Note: all the data in percentage
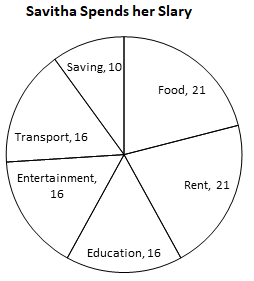
Q1. If saving amount is 12,000 ,then find her salary ?
1. Rs.1,15,000 2. Rs.1,20,000 3. Rs.1,10,000 4. Rs.1,00,000
Q2. Amount spent on Transport is what % of the amount spent on food ?
1. 65% 2. 80% 3. 76% 4. 71%
Q3.How much money spent for entertainment and rent together ?
1. Rs.44,400 2. Rs.40,000 3. Rs.44,000 4. Rs.39,500
Q4. Ratio between the amount spent on Education and Saving ?
1. 2:5 2. 1:3 3. 8:5 4. 2:5
Q5. If her salary is increased by 20% and decreased by 5% then what will be her salary now ?
1. Rs.1,36,800 2. Rs.1,44,000 3. Rs.1,36,000 4. Rs.1,32,000
1. 2
2. 3
3. 1
4. 3
5. 1