Refer to Pie Charts and answer the following questions:
Given Data:
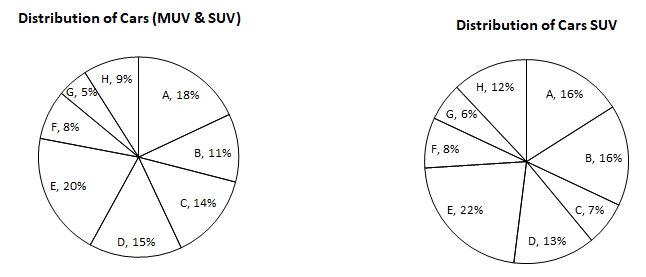
Total number of cars (both MUV & SUV) distributed by 8 dealers in 2004 = 56000
Total number of SUV cars distributed by 8 dealers in 2004 = 32000
Q1. Total number of MUV cars sold by dealers C and H together is by what % less than total number of cars(both SUV and MUV) sold by stores F and H together?
1. 27.58% 2. 25.58% 3. 26.58% 4. 28.57%
Q2.The number of cars( MUV and SUV) sold by store D is by what % more than total number of SUV cars distributed by dealers C, F and G together?
1. 50% 2. 25% 3. 75% 4. 605
Q3. What is the average number of MUV cars delivered by dealers A, D, E, F and H together?
1. 2892 2. 3354 3. 3634 4. 3296
Q4. What is the respective ratio between total no of SUV cars distributed by dealers A and B together and total number of cars(MUV and SUV) delivered by stores C and F together?
1. 64:77 2. 64:79 3. 54:77 4. 64:73
Q5. If the number of cars distributed by stores A, D and E increased by 10%, 35% and 15% respectively from 2004-2005, what was the total number of MUV cars distributed by these three dealers in 2005?
1. 14964 2. 15964 3. 13964 4. 12964
[expand title=”Answers”]
1. 4
2. 2
3. 4
4. 1
5. 2
[/expand]