Directions (11-15): Study the following graph carefully and answer the questions given below:
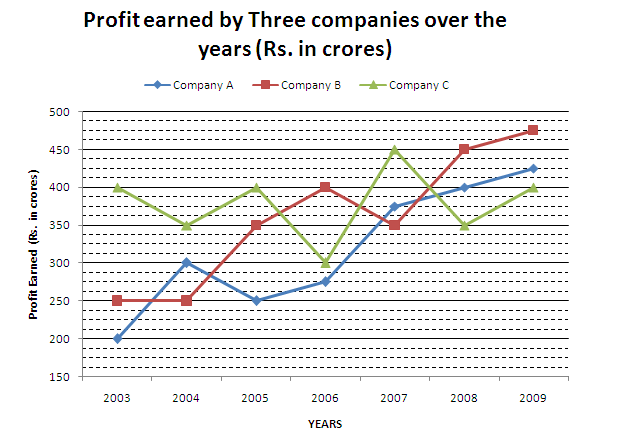
Q11. What was the average profit earned by all the three companies in the year 2008?
(a) Rs. 300 crore
(b) Rs. 400 crore
(c) Rs. 350 crore
(d) Rs. 520 crore
(e) None of these
Q12. In which of the following years was the difference between the profits earned by company B and company A the minimum?
(a) 2003
(b) 2004
(c) 2005
(d) 2008
(e) None of these
Q13. In which of the following years was the total profit earned by all three companies together with the highest?
(a) 2004
(b) 2007
(c) 2008
(d) 2009
(e) None of these
Q14. What was the approximate percentage increase in the profit earned by Company A from 2006 to 2007?
(a) 36
(b) 24
(c) 40
(d) 20
(e) 54
Q15. What was the difference between the profit earned by company A in 2004 and the profit earned by company C in 2009?
(a) Rs. 50crore
(b) Rs. 1 crore
(c) Rs. 100 crore
(d) Rs. 200 crore
(e) None of these
Answer & Explanation