Directions (6-10): Study the following graph carefully to answer these questions.
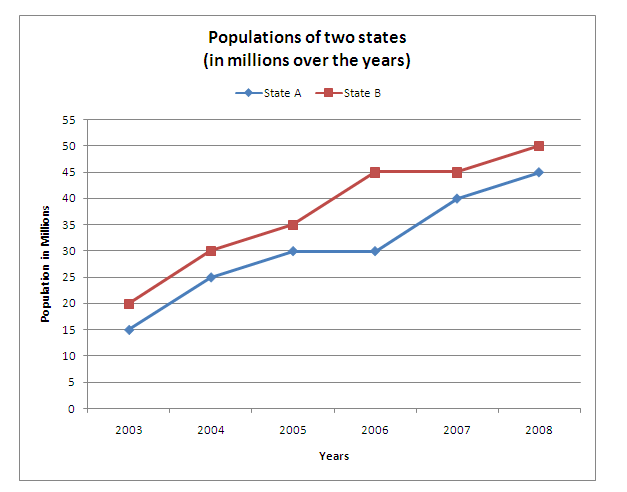
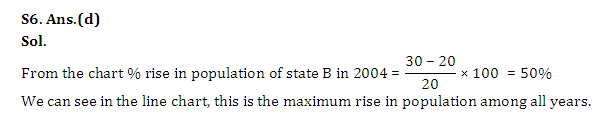
Q6. For state B the per cent rise in population from the previous year was the highest in which of the following years?
(a) 2008
(b) 2006
(c) 2005
(d) 2004
(e) 2007
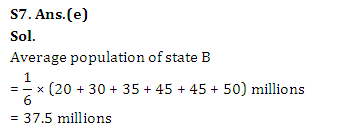
Q7. What was the average population of state B (in millions) for all the years together?
(a) 38.5
(b) 28.5
(c) 35
(d) 26.85
(e) 37.5
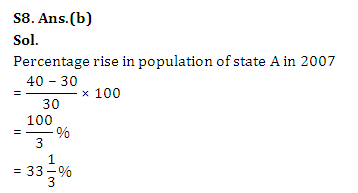
Q8. What is the per cent rise in population of state A in 2007 from the previous year?
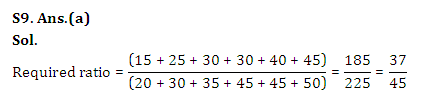
Q9. What is the ratio between the total population of state A and that of state B respectively for all the years together?
(a) 37: 45
(b) 37: 43
(c) 43: 37
(d) 45: 37
(e) None of these
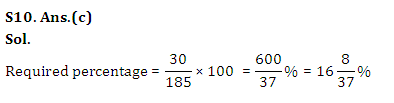
Q10. The population of state A in 2005 is what percent of its total population for all the years together for the same state?
Answer & Explanation