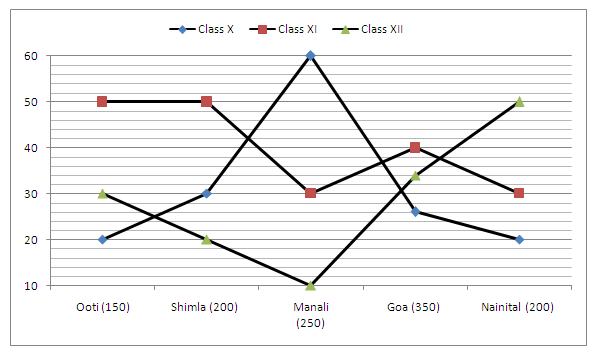
Directions (Q1- 5): Study the bar graph given below and answer the following questions:
The bar graph below shows the percentage break-up of the number of students who visited various tourist spots on New Year Evening.
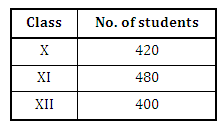
The table below shows the total number of students in classes X, XI and XII.
Note: No Student went to more than one place.
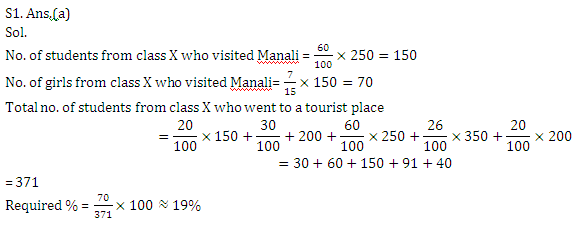
Q1. If the ratio of girls and boys, who went to Manali from class X, was 7 : 8, then what percent of the total number of students from class X who went to a tourist spot is the number of girls who went to Manali? (approximate)
(a) 19%
(b) 23%
(c) 25%
(d) 15%
(e) 21%
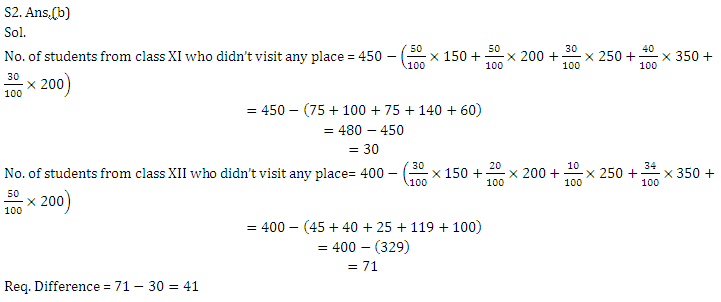
Q2. What is the difference between the number of students who did not got to any tourist spotfrom class XI and that from class XII?
(a) 19
(b) 41
(c) 27
(d) 21
(e) None of these
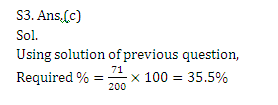
Q3. If all the students from class XII who did not go to any tourist spot, later changed their mind and went to Nainital, then calculate the % mark-up in the number of students who visited Nainital?
(a) 30%
(b) 25.5%
(c) 35.5%
(d) 42.6%
(e) None of these
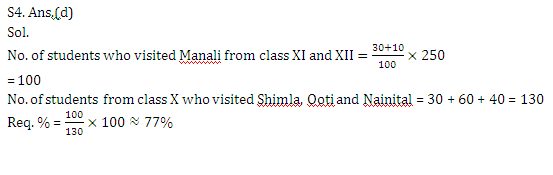
Q4. The number of students from class XI and XII together who visited Manali is what percent of the number of students from class X who visited Shimla, Ooty and Nainital together? (approximate)
(a) 81%
(b) 72%
(c) 75%
(d) 77%
(e) 70%
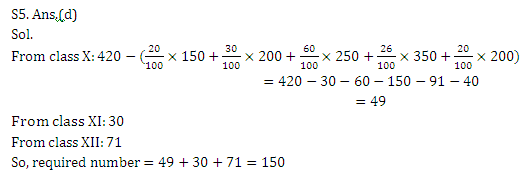
Q5. Find the total number of students who didn’t visit any tourist spot?
(a) 152
(b) 165
(c) 105
(d) 150
(e) None of these
Answer & Explanation