Directions (Q.6-10): Study the following graph carefully to answer these questions :
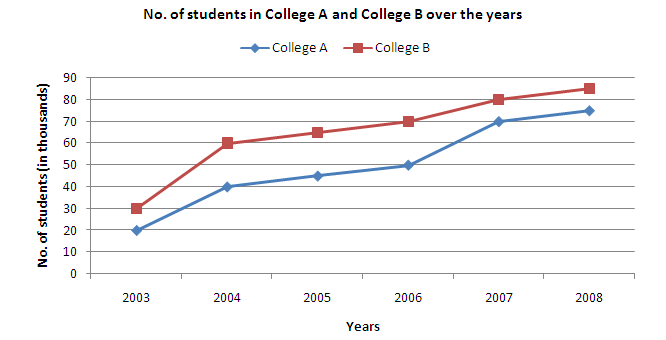
Q6. Total number of students of College B in years 2005, 2006 and 2003 together are what percent more/less then total number of students of College A in years 2003, 2004 and 2008 together?
Q7. What is the ratio of the total number of students of College A in years 2004, 2006 and 2007 together and the total number of students of College B in years 2003, 2004 and 2008?
(a) 35 : 32
(b) 33 : 37
(c) 34 : 31
(d) 32 : 35
(e) None of these
Q8. What is the average number of students in College A for all the years together?
(a) 45,000
(b) 50,000
(c) 52,000
(d) 48,000
(e) None of these
Q9. What is the approximate percentage rise in the number of students of College B from 2005 to 2006?
(a) 8
(b) 12
(c) 4
(d) 15
(e) 20
Q10. The number of students of College B in year 2008 is what percent of the total students of College B in all the years together (Round off to two digits after decimal)
(a) 20.61
(b) 23.79
(c) 21.79
(d) 17.29
(e) None of these
Answer & Explanation