Directions (Q.1-5): The following line graph gives the annual percent profit earned by two businessmen during the period 2008-2013. Study the graph and answer the questions based on it. Percent profit earned by two businessmen over the years
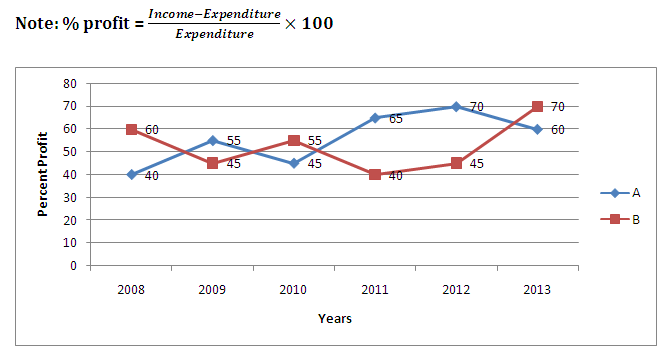
Q1. What is the average profit percent earned by A and B throughout the years?
Q2. If in year 2010, the expenditure made by A was Rs. 5 lakhs, then what was the income in that year?
(a) Rs. 7,22,000
(b) Rs. 7,25,500
(c) Rs. 7,25,000
(d) Rs. 7,50,000
(e) None of these
Q3. If in year 2012 the income of A and B was Rs. 18.7 lakhs and Rs. 20.3 lakhs respectively, the expenditure of B was by about what percent more or less than that of A in that year?
(a) 27% more
(b) 27% less
(c) 26% more
(d) 26% less
(e) 37% more
Q4. If the income of B remains same throughout the years i.eRs. 3.4 lakhs then in which year his expenditure was minimum and what was the expenditure in that year?
(a) 2013, Rs. 2,20,000
(b) 2012, Rs. 2,00,000
(c) 2013, Rs. 2,00,000
(d) 2013, Rs. 2,50,000
(e) None of these
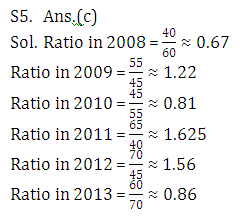
Q5. In which year the ratio of profit percent of A and B has the maximum numeric value?
(a) 2009
(b) 2008
(c) 2011
(d) 2012
(e) 2013
Answer & Explanation