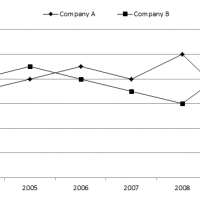
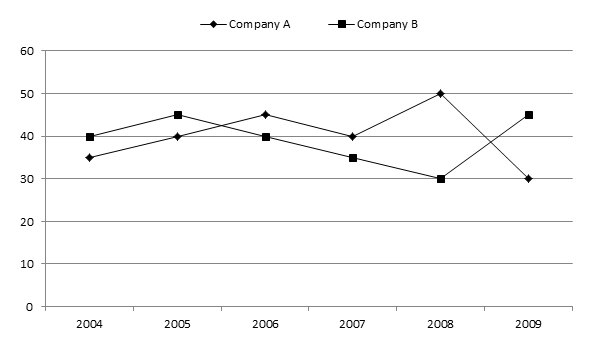
Study the graph carefully to answer the questions that follow:
Percent profit made by two companies over the years.
Percent Profit = [(Income – Expenditure)/Expenditure]*100
Q1. If in the year 2004 the expenditures incurred by company A and B were the same, what was the ratio of the income of company A to that of Company B in that year?
1. 25 : 26 2. 26 : 27 3. 20 : 21 4. 27 : 28 5. None of these
Q2. What is the sum of the average per cent profit earned by company B and A over all the years together?
1. 69.16 2. 79.16 3. 89.16 4. 59.16 5. None of these
Q3. If the amount of profit earned by company A in the year 2007 was Rs.1.5 lakhs, what was its expenditure in that year?
1. 3.75 lakh 2. 4.50 lakh 3. 9.25 lakh 4. 5.75 lakh 5. None of these
Q4. If in the year 2008, the incomes of both companies A and B were same, What was the ratio of expenditure of Company A to the expenditure of Company B in that year?
1. 14 : 15 2. 13 : 14 3. 15 : 16 4. 13 : 15 5. None of these
Q5. What is the ratio of the amount of profit earned by company A to that by company B in the year 2009?
1. 2 : 3 2. 4 : 7 3. 11 : 15 4. Cannot be determined 5. None of these
1. 4
2. 2
3. 1
4. 4
5. 4