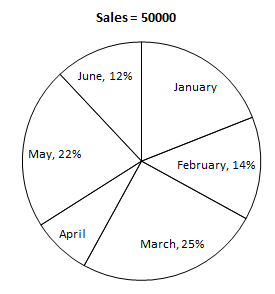
Study the following pie chart carefully and answer the questions given below.
Percentage wise distribution of the number of mobile phones sold by a shopkeeper during six months
The respective ratio between the numbers of mobile phones sold of company Nokia and Samsung during six months
| Months | Nokia : Samsung |
| January | 10:9 |
| February | 4:3 |
| March | 2:3 |
| April | 3:5 |
| May | 6:5 |
| June | 3:2 |
Q1. If in January the total mobile sold was 19%, then what is the ratio between the number of Nokia mobiles sold in January to the number of Samsung mobiles sold in April?
1.3:5 2.5:7 3.2:1 4.3:2 5.Cannot be determined
Q2. What is the respective ratio between the number of mobile phones sold of Nokia in February to the number of mobile phones sold of Samsung in June?
1.3:5 2.5:3 3.2:1 4.1:2 5.Cannot be determined
Q3.If the shopkeeper earned a total profit Rs. 1250000 on selling Samsung mobiles during May, what was his profit earned on each mobile phones of that company during the same month?
1.250 2.300 3.350 4.400 5.Cannot be determined
Q4. In how many months the number of Nokia mobiles sold is more than the number of Samsung mobiles sold?
1.Two 2.Three 3.Four 4.Five 5.Six
Q5. What is the difference between the total number of Nokia mobiles sold to the number of Samsung mobile sold over the years?
1.150 2.200 3.250 4.300 5.400
[expand title=”Answers”]
1. 3
2. 2
3. 1
4. 3
5. 2
[/expand]