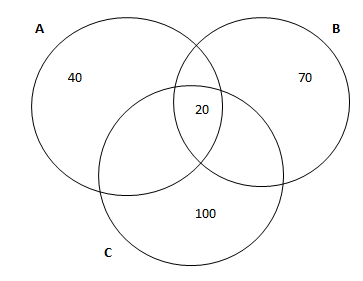
Study the following diagrams carefully and answer the questions
The students of a class drink different beverages; A, B, and C. A total of 100 students drink A, 150 drink B and 200 drink C.
| Beverage | Boy to Girl ratio |
| A Only | 5:3 |
| B Only | 7:3 |
| C Only | 13:12 |
| A & B only | 4:1 |
| A & C only | 7:8 |
| B & C only | 1:4 |
| A, B & C | 3:1 |
[expand title=”Explanation”]
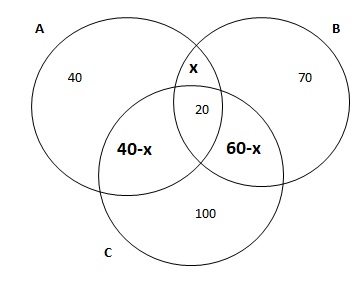
C = 200
100+20+(40-x)+(60-x) = 200
40-x+60-x = 200-120
100 – 2x = 80
100 – 80 = 2x
x = 10
[/expand]
Q1. What is the total number of students in that class?
1. 300 2. 450 3. 320 4. 420 5. None of these
Q2. What the ratio of males who drink only A to the girls who drink A , B and C?
1. 25 : 1 2. 5 : 1 3. 5 : 3 4. 1 : 5 5. None of these
Q3.What is the difference between the total number of boys and girls of that class?
1. 32 2. 24 3. 30 4. 26 5. 28
Q4. What percentage of the total boys drink beverages both A & B ?
1. 14.94 2. 13.29 3. 4.29 4. 4.62 5. None of these
Q5.The girls who drink only beverage A forms what percent of the whole class?
1. 4.21 2. 4.36 3. 4.68 4. 4.86 5. 4.92
[expand title=”Answers”]
1. 3
2. 2
3. 4
4. 2
5.3
[/expand]