Direction Q(1-5): Study the following graph carefully to answer the given questions
Distribution of 1100 School Students in different Sections
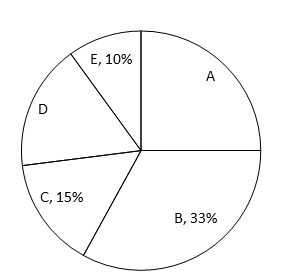
Table shows the portion of boys and portion of student whose age is under 18 years
| Section | No of Boys | % of students below 18 |
| A | 180 | 32% |
| B | 265 | 10% |
| C | 72 | |
| D | 87 | 45% |
| E | 25% |
Q1. The number of girls in section A is 95, then find the number of students whose age is under 18 in same section?
1.93 2.88 3.72 4.110 5.None of these
Q2. If the total number of students in Section D is 187, then find the number of total girls in Section A, B and D?
1.293 2.301 3.268 4.195 5.None of these
Q3. If in Section E , the ration of boys and girls is 6:5, then find the ratio of no of boys above 18 and below 18?
1.1:3 2.2:3 3.3:1 4.1:2 5.None of these
Q4.What is the difference between the total number of students below 18 in Section A and D to the total number of Boys in E, C and?
1.50 2.45 3.37 4.40 5.None of these
Q5.If in section C, there are no students below 18, then find the average number of students below 18 in all section together approximately?
1.47 2.35 3.29 4.17 5.None of these
[expand title=”Answers”]
1. 2
2. 1
3. 3
4. 4
5. 1
[/expand]