
Study the following graph carefully and answer accordingly.
Number of students playing Carrom, Cricket, Hockey from different Schools
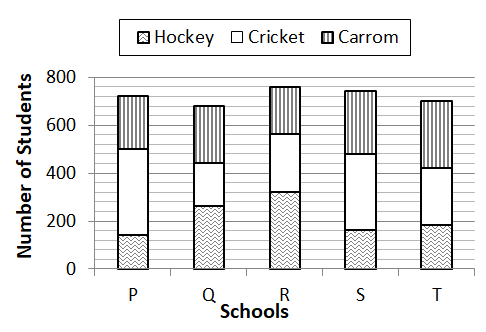
Q1. Total number of students playing Carrom and Hockey together from school P is what % of the total number of students playing these two games together from School R?
1. 950/13 % 2. 980/13 % 3. 960/13 % 4. 900/13 %
Q2. If the number of students playing each game in school S is increased by 15% and the number of students playing each game in school Q is decreased by 5% then what will be the difference between number of students in School S and Q?
1. 205 2. 305 3. 105 4. 405
Q3. If out of the students playing cricket from schools Q, S and T, 40%,35% and 45% respectively got selected for state level competition, what was the total number of students got selected for state level competition from these three schools together?
1. 294 2. 292 3. 300 4. 302
Q4. Total number of students playing Hockey from all schools together is approximately, what percent of the total number of students playing cricket from all schools together?
1. 70% 2. 65% 3. 79% 4. 89%
Q5. From School P, out of the students playing Carrom, 40% got selected for state level competition out of which 25% further got selected for national level competition.From School T, out of the students playing Carrom, 45% got selected for state level competition out of which two-third further got selected for national level competition.What is the total number of students playing Carrom from these two schools who got selected for national level competition?
1. 108 2. 106 3. 103 4. 102
1. 4
2. 1
3. 2
4. 3
5. 2