
Study the given graph carefully to answer the questions that follow.
Number of people (in thousand) using three different types of mobile services over the years
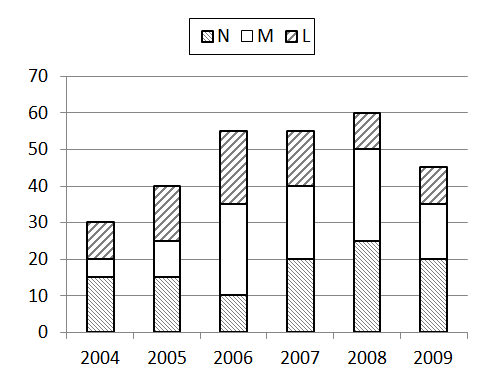
Q1. What is the total number of people using mobile service M in the years 2008 and 2009 together?
1. 35000 2. 30000 3. 25000 4. None of the Above
Q2. Number of people using mobile service N in the year 2006 forms approximately, what percent of the total number of people using all the three mobile services in that year?
1. 11% 2. 13% 3. 17% 4. 18%
Q3.What is the respective ratio of number of people using mobile service L in the year 2005 to those using the same service in the year 2004?
1. 8:7 2. 3:2 3. 17:19 4. 23:25
Q4. The total number of people using all the three mobile services in the year 2007 is what percent of the total number of people using all the three mobile services in the year 2008?(rounded off two digits after decimal)
1. 92.69% 2. 91.67% 3. 94.65% 4. 95.68%
Q5. What is the average number of people using mobile service M for all the years together?
1. 50/3 thousand 2. 44/3 thousand 3. 55/3 thousand 4. 65/3 thousand
1. 4
2. 4
3. 2
4. 2
5. 1