Directions (11-15): Study the graph and answer the following questions.
Power Supply Position in UP (in billion KWH)
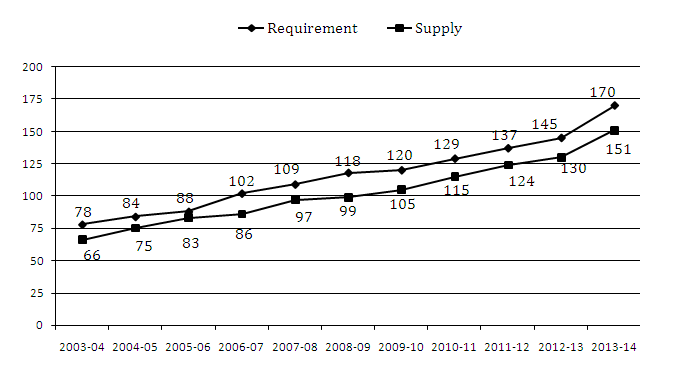
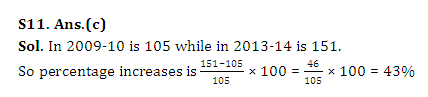
Q11. What was the approximate percentage increase in supply of power between 2009-10 and 2013-14?
(a) 56%
(b) 145%
(c) 43%
(d) 85%
(e) None of these
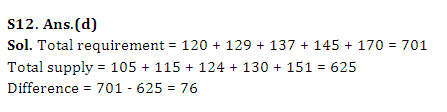
Q12. The cumulative shortfall between requirement and supply from 2009 to the end of 2014 was (in billion)
(a) 56
(b) 85
(c) 45
(d) 76
(e) None of these
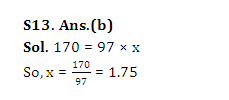
Q13. The requirement of power in 2013-14 was approximately how many times the availability of supply in 2007-08?
(a) 2.6
(b) 1.75
(c) 2.75
(d) 2.0
(e) None of these
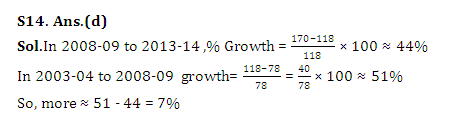
Q14. The percentage of growth in power requirement from 2008-09 to 2013-14 was less than the percentage of growth in power requirement from 2003-04 to 2008-09 by what figure?
(a) 3
(b) 4
(c) 15
(d) 7
(e) None of these
Q15. Between 2008-09 and 2012-13, the power generation has generally logged behind power demand by how many years?
(a) 1
(b) 2
(c) 3
(d) 4
(e) None of these
Answer & Explanation