Directions (1-5): Study the following graph to answer the given questions.
Percent profit earned by two companies over the given years
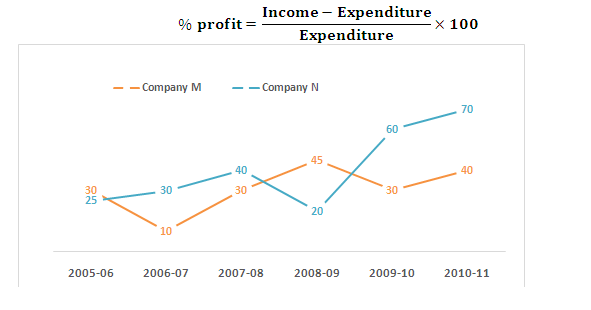
Q1. For Company M, its income in 2009-10 was equal to its expenditure in 2010-11, what was the ratio of its respective incomes in these two years?
(a) 4:5
(b) 3:4
(c) 5:7
(d) Cannot be determined
(e) None of these
Q2. If the income of Company M in 2006-07was equal to the expenditure of Company N in 2009-10 what was the ratio of their respective profits?
(a) 13:15
(b) 15:26
(c) 13:26
(d) Cannot be determined
(e) None of these
Q3. What was the difference in the expenditures of the two companies in 2007-08?
(a) 10
(b) 100
(c) 1000
(d) Cannot be determined
(e) None of these
Q4. In 2010-11 the income of Company N was Rs. 119 crores. What was its expenditure in that year?
(a) Rs. 76.8 crore
(b) Rs. 64 crore
(c) Rs. 70 crore
(d) Cannot be determined
(e) None of these
Q5. For Company N, in which year is the percent of increase in percent profit over that of previous year the highest?
(a) 2011-12
(b) 2007-08
(c) 2010-11
(d) Cannot be determined
(e) None of these
Answer & Explanation