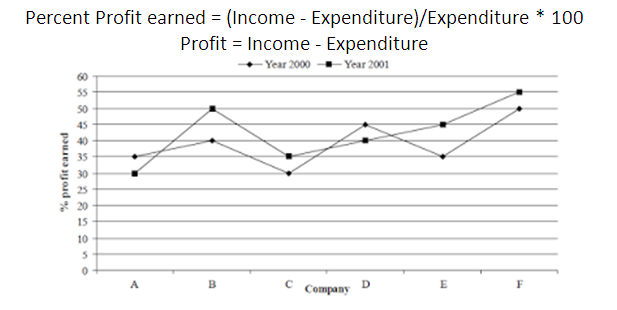
Directions (Q. 1-5): Study the following graph and answer the questions given below.
Q1. If the income of Company A in the year 2001 was Rs 40 lakhs, what was its expenditure in that year?
(a)Rs 20 lakhs
(b)Rs 30.76 lakhs
(c)Rs 31.84 lakhs
(d) Cannot be determined
(e) None of these
Q2. If in the year 2001, total expenditure of Company B and C was Rs 42 lakhs, then what was their total income in the same year?
(a)Rs 32 lakhs
(b)Rs 62 lakhs
(c)Rs 63 lakhs
(d) Cannot be determined
(e) None of these
Q3. If in the year 2000, expenditure of Company C was Rs 36 lakhs, what was the income in the same year?
(a)Rs 34.6 lakhs
(b)Rs 32.8 lakhs
(c)Rs 30 lakhs
(d)Rs 46.8 lakhs
(e) None of these
Q4. If the expenditure of Company E in the years 2000 and 2001 were the same, what was the ratio of the incomes of the company in same years respectively?
(a)23 : 29
(b)27 : 31
(c)27 : 29
(d)23 : 27
(e) None of these
Q5. The income of Company D in the year 2000 was Rs 51 lakhs. What was the earned profit?
(a)Rs 15.83 lakhs
(b)Rs 17.8 lakhs
(c)Rs 16.83 lakhs
(d)Rs 13 lakhs
(e) None of these
Answers 1.b 2.d 3.d 4.c 5.a