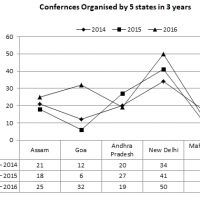
Study the following graph carefully to answer the given Questions
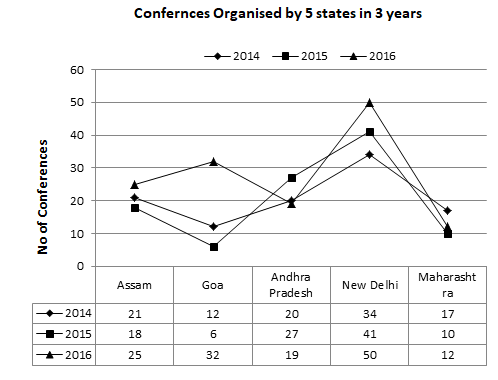
Q1. How many conferences totally organised by five states in the year 2014 and 2015 ?
1.197 2.243 3.312 4.206 5.None of these
Q2. If the years are arranges in descending order of the total no of conferences organised by given states, which of the following would be the correct order ?
1. 2014, 2015, 2016 2. 2016, 2014, 2015 3. 2016, 2015, 2014 4. 2014, 2016, 2015 5. None
Q3. Approximately how much % increase in the no of conferences organised from 2014 to 2016 by Goa ?
1.126% 2.156% 3.176% 4.167% 5. None of these
Q4. What is the average no of conferences organised by the state Andhra Pradesh in all the three years ?
1. 22 2.18 3. 20 4. 32 5. None of these
Q5. What is the difference between the no of conferences organised by New Delhi in 2016 to no of conferences organised by Maharashtra in 2014 ?
1. 35 2. 29 3. 33 4. 27 5. None of these
1. 4
2. 2
3. 4
4. 1
5. 3