Study the following graph to answer the given questions: –
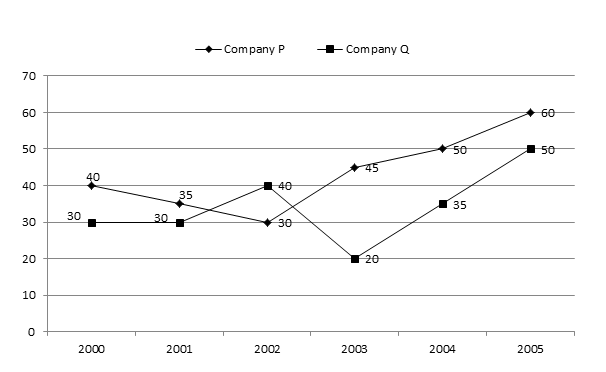
Percent profit earned by two companies over the given years.
% profit = [(income –expenditure)/(expenditure)]*100
Q1. If the expenditure of company P in 2000 was Rs. 200 crores, what was its income?
1. 200 2. 220 3. 260 4. 280 5. None of these
Q2. If the income of company Q in 2004 was Rs. 600 crores, what was its expenditure?
1. 444 2. 440 3. 480 4. 484 5. None of these
Q3. If the incomes of two companies are equal in 2001, what was the ratio of their expenditures?
1. 25:27 2. 27:26 3. 26:27 4. 30:31 5. None of these
Q4. What is the percent increase in the percent profit for company Q from year 2000 to 2002?
1. 20% 2. 25% 3. 33.33% 4. 46.67% 5. None of these
Q5. If the expenditure of both the companies are equal in 2005, find the ratio of their income?
1. 14:15 2. 16:15 3. 15:16 4. 15:14 5. None of these
Answers
1.4
2.1
3. 3
4.3
5.2