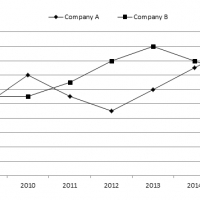
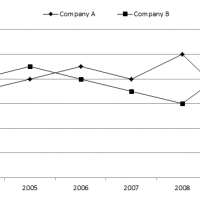
DI Line Diagram

Line Diagram 3

Line Diagram 3

Study the following information carefully to answer the given question: Q1. Number of Project handled by Company BBP decreased by what percentage from 2013 to 2015 ? 1.12.63%              2.18.42%            3.15.23%             4.16.24%            5.None of these Q2. Out of the total no of projects handled by PPB in 2013 and 2014 together, 20% were Governmental projects. What

Line Diagram 3 Read More »

Line Diagram 2

Line Diagram 2

Study the following graph carefully to answer the given Questions Q1. How many conferences totally organised by five states in the year 2014 and 2015 ? 1.197             2.243            3.312            4.206       5.None of these Q2. If the years are arranges in descending order of the total no of conferences organised by given states, which of the

Line Diagram 2 Read More »