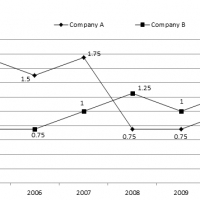
Answer the questions based on the given line graph.
Ratio of exports to imports of two companies over the years.
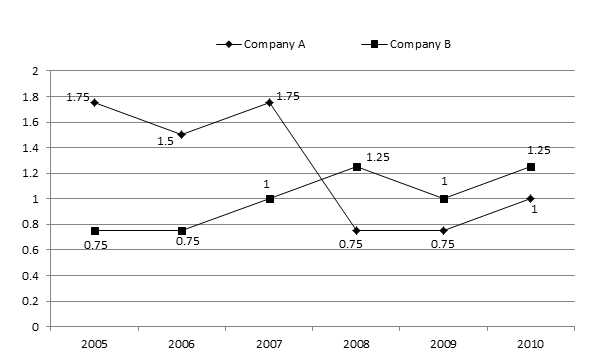
Q1. In how many of the given years were the exports more than the imports for company A?
1. 2 2. 3 3. 4 4. 5 5. None of these
Q2. If the imports of company A in 2007 were increased by 40%, what would be the ratio of exports to the increased imports?
1. 1.20 2. 1.25 3. 1.30 4. Can not be determined 5. None of the Above
Q3. If the exports of company B in 2008 were Rs.237 crore, what was the amount of imports in that year?
1. 189.6 crore 2. 243.8 crore 3. 281.5 crore 4. 316.7 crore 5. None of the Above
Q4. In 2005, the export of company A was double that of company B. If the imports of company A during the year was Rs 180 crores, what was the approximate amount of imports profit company B during that year?
1. 190 crore 2. 210 crore 3. 225 crore 4. Can not be determined 5. None of the Above
Q5. In which year were the exports of company A minimum proportionate to its imports?
1. 2010 2. 2009 3. 2008 and 2010 4. 2005 and 2007 5. None of the Above
[expand title=”Answers”]
1. 2
2. 2
3. 1
4. 2
5. 2
[/expand]