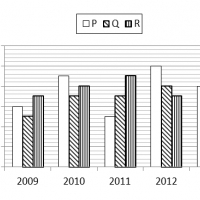
Production of three Company P, Q and R For Five years

Q1. The percentage increase in production of company Q from the year 2009 to the year 2013 is _______
1. 50% 2. 40% 3. 60% 4. 100%
Q2. The Average production over the years 2009-2013 was maximum for the companies?
1. Q 2. P 3. R 4. P & R
Q3. The percentage rise or fall in production of company Q as compared to the previous year is the maximum in the year
1. 2010 2. 2011 3. 2012 4. 2013
Q4. The percentage of production of company R to the production of company Q is the maximum in the year?
1. 2010 2. 2011 3. 2009 4. 2013
Q5. The ratio of the average production of company P during the year 2011 to 2013 to the average production of company Q for the same period is ________
1. 11:13 2. 13:15 3. 17:19 4. 23:25
[expand title=”Answers”]
1. 4
2. 4
3. 1
4. 3
5. 4
[/expand]