
Study the following bar graph carefully to answer the given questions
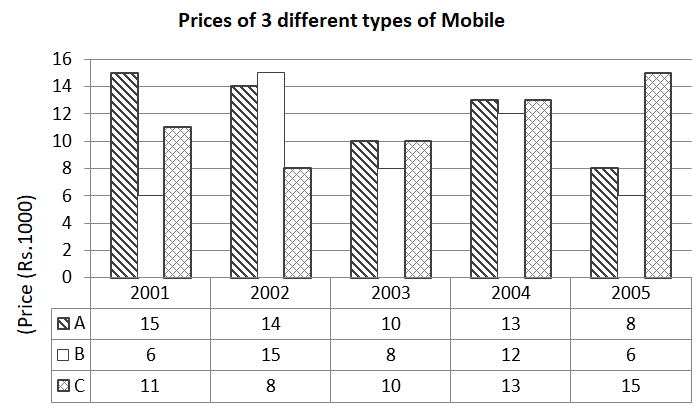
Q1. Find the average price of Mobile C in all the five years together ?
1. Rs.11000 2. Rs.11400 3. Rs.12600 4. Rs.12800
Q2. The price of A in 2001 is what % more than the price of C in 2001 ?
1. 37% 2. 43% 3. 32% 4. 52%
Q3. Which of the following mobile has the maximum average price during the given 5 years ?
1. A 2. B 3. C 4. Both A and B
Q4. If the company B sold 1300 mobiles in 2005, he earned 3% profit for each mobile then what will be the total amount he earned ?
1. Rs.76,80,000 2. Rs.85,46,000 3. Rs.80,34,000 4. Rs.80,30,000
Q5. Find the difference between the price of Mobile A in 2003 and Mobile C in 2004 ?
1. Rs.300 2. Rs.30 3. Rs.3300 4. Rs.3000
[expand title=”Answers”]
1. 2
2. 1
3. 1
4. 3
5. 4
[/expand]