DI Bar Diagram

Bar Diagram 27

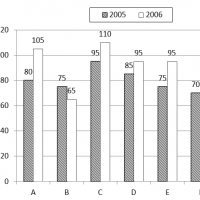
The following bar chart shows the trends of foreign direct investments(FDI) into India from all over the world. Q1.What was the ratio of investment in 1997 over the investment in 1992 ? A. 5.50 B. 5.36 C. 5.64 D.5.75Q2. What was absolute difference in the FDI to India in between 1996 and 1997 ? A. […]

Bar Diagram 27 Read More »

Bar Diagram 26

Directions (1-5): The expenditure and percentage profit of two companies A and B for six years in the period 2001-2006 are shown in the given bar graph and line graph. The expenditure is given in  lakhs. Q1. What is the difference between the average expenditure of Company A from 2001 to 2006 and that of Company B?

Bar Diagram 26 Read More »

Bar Diagram 25

Directions (1-5): In a company there are five different departments (A, B, C, D and E). In each department, a certain number of male and female employees are working. The given bar chart shows the number of employees working in each department and the line graph shows the ratio of male to female workers in each

Bar Diagram 25 Read More »

Bar Diagram 24

Directions—(Q. 1–5) Study the following graph carefully to answer the questions— The following Bar graph gives the number of products manufactured and sold by a company over the years. (in thousands) Q1. What is the difference in the number of products manufactured by the Company in the year 2009 and 2008 ? (1) 4000 (2) 5500

Bar Diagram 24 Read More »

Bar Diagram 23

Directions—(Q. 1–5) Study the following graph carefully to answer the questions— The following Bar graph gives the number of products manufactured and sold by a company over the years. (in thousands) Q1. What is the difference in the number of products manufactured by the Company in the year 2009 and 2008 ? (1) 4000 (2) 5500

Bar Diagram 23 Read More »

Bar Diagram 22

Directions: (1 – 5):  The bar graph given below shows the foreign exchange reserves of a country (in million US $) from 1991-92 to 1998-99. Answer the questions based on graph. Q1. The foreign exchange reserves in 1997-98 was how many times that in 1994-95 (1) 1.5                    (2) 2 (3) 3.5                    (4) 2.6 (5) None of

Bar Diagram 22 Read More »

Bar Diagram 21

Directions:- (1-4)The following line graph gives the percentage of the number of candidates who qualified an examination out of the total number of candidates who appeared for the examination over a period of seven years from 2003 to 2009. Percentage of Candidates Qualified to Appeared in an Examination  Over the Years Q1. If the number

Bar Diagram 21 Read More »

Bar Diagram 20

Direction (1-5): Study the following graph carefully and answer the questions given below it. Production and sale of printers of various companies in a month. Q1. What is the average number of units sold by all the companies together? (1) 360                   (2) 390             (3) 375 (4) 410                   (5) None of these Q2. Which company had

Bar Diagram 20 Read More »

Bar Diagram 19

Directions: ( 1–5):Read the graph and answer questions . Income and Expenditure of a company over the year (in lakhs of rupees).    Q1. The ratio of the average income of all the years to the average profit is : (a) 24 : 13                          (b) 48 : 17 (c) 12 : 7                            (d) 6 :

Bar Diagram 19 Read More »